MEC_5608_sm_SupportingInformation
advertisement
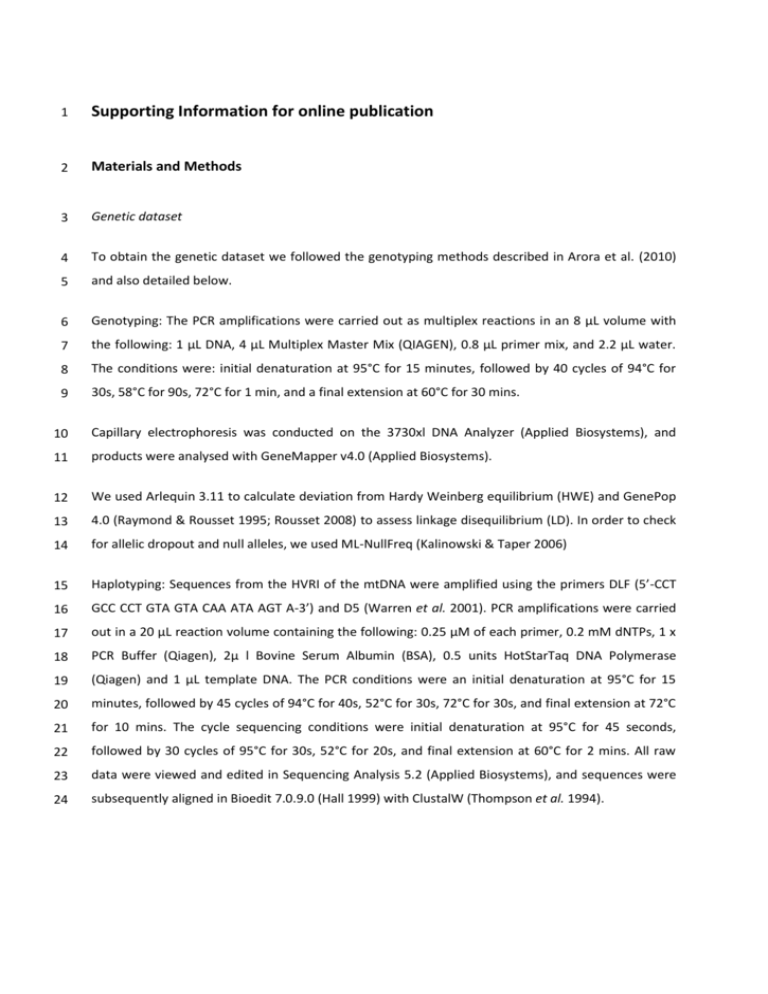
1 Supporting Information for online publication 2 Materials and Methods 3 Genetic dataset 4 To obtain the genetic dataset we followed the genotyping methods described in Arora et al. (2010) 5 and also detailed below. 6 Genotyping: The PCR amplifications were carried out as multiplex reactions in an 8 μL volume with 7 the following: 1 μL DNA, 4 μL Multiplex Master Mix (QIAGEN), 0.8 μL primer mix, and 2.2 μL water. 8 The conditions were: initial denaturation at 95°C for 15 minutes, followed by 40 cycles of 94°C for 9 30s, 58°C for 90s, 72°C for 1 min, and a final extension at 60°C for 30 mins. 10 Capillary electrophoresis was conducted on the 3730xl DNA Analyzer (Applied Biosystems), and 11 products were analysed with GeneMapper v4.0 (Applied Biosystems). 12 We used Arlequin 3.11 to calculate deviation from Hardy Weinberg equilibrium (HWE) and GenePop 13 4.0 (Raymond & Rousset 1995; Rousset 2008) to assess linkage disequilibrium (LD). In order to check 14 for allelic dropout and null alleles, we used ML-NullFreq (Kalinowski & Taper 2006) 15 Haplotyping: Sequences from the HVRI of the mtDNA were amplified using the primers DLF (5’-CCT 16 GCC CCT GTA GTA CAA ATA AGT A-3’) and D5 (Warren et al. 2001). PCR amplifications were carried 17 out in a 20 μL reaction volume containing the following: 0.25 μM of each primer, 0.2 mM dNTPs, 1 x 18 PCR Buffer (Qiagen), 2μ l Bovine Serum Albumin (BSA), 0.5 units HotStarTaq DNA Polymerase 19 (Qiagen) and 1 μL template DNA. The PCR conditions were an initial denaturation at 95°C for 15 20 minutes, followed by 45 cycles of 94°C for 40s, 52°C for 30s, 72°C for 30s, and final extension at 72°C 21 for 10 mins. The cycle sequencing conditions were initial denaturation at 95°C for 45 seconds, 22 followed by 30 cycles of 95°C for 30s, 52°C for 20s, and final extension at 60°C for 2 mins. All raw 23 data were viewed and edited in Sequencing Analysis 5.2 (Applied Biosystems), and sequences were 24 subsequently aligned in Bioedit 7.0.9.0 (Hall 1999) with ClustalW (Thompson et al. 1994). 25 Statistical descriptors to detect sex-biased dispersal 26 We also assessed sex-biased dispersal using the statistical descriptors proposed by Goudet et al. 27 (2002): i) FIS, tests for heterozygote deficiency, and is expected to be positive for the dispersing sex as 28 they should be composed of residents as well as non residents, resulting in a Wahlund effect and 29 therefore a heterozygote deficit; ii) HO, the observed heterozygosity, which provides information on 30 inbreeding; iii) HE, expected heterozygosity or gene diversity; iv) mean of the corrected assignment 31 index (mAIc), calculates the probability of a multilocus genotype in a population and is expected to 32 be higher for the philopatric sex; and v) variance of the corrected assignment index (vAIc), computes 33 the spread from the mean for the assignment indices and is expected to be higher for the dispersing 34 sex (Goudet et al. 2002). We estimated FIS, HO and HE using GENETIX (Belkhir et al. 1996-2004; 35 available at http://kimura.univ-montp2.fr/genetix/). The deviation of FIS from Hardy Weinberg 36 Equilibrium was tested through 1000 permutations. Estimates of mAIc and vAIc were calculated with 37 FSTAT 2.9.3.2 (Goudet 1995), and significance levels were obtained through 1000 randomizations 38 and a two-tailed t-test. 39 Marker informativeness and estimator performance 40 Recent analyses have shown that different relatedness estimators vary in their precision depending 41 on number of markers, levels of polymorphism, allele frequency distributions, and population 42 composition (Van de Casteele et al. 2001; Csillery et al. 2006; Wang 2006). Furthermore, the 43 available estimators also perform differently depending on the true relatedness being assessed 44 (Csillery et al. 2006; Wang 2006). 45 We assessed the information content of the markers and simulated their overall power for 46 relatedness estimation using KinInfor v1.0 (Wang 2006). First, we examined two measures of 47 information content: i) Ir, the informativeness of relatedness as a continuous measure of identity by 48 descent, and ii) IR, the informativeness of discrete relationship categories. Our specifications were 49 parent-offspring (PO) and unrelated (U) dyads as the primary and null hypothetical relationships, 50 respectively, a Dirichlet distribution of (1, 1, 1) that takes into account uncertainty in the distribution 51 of relationships, and a significance level of 0.05. Next, we conducted iterative simulations of 100,000 52 dyads on KinInfor to quantify the power of the highest ranking marker, the second-highest ranking 53 markers, and so on, until we had assessed the six markers used in the identification analyses and a 54 few more (to a total of ten markers). For these simulations we evaluated the discrimination power of 55 half-sib (HS) versus U dyads, and PO versus U dyads. 56 In order to choose suitable relatedness estimators we used KinInfor to compute the multilocus 57 reciprocal of the mean squared deviations (RMSD) of relatedness estimates, which measures marker 58 information according to estimator. The moment estimators of Wang (2002), Lynch & Li (Lynch 1988; 59 Li et al. 1993), Lynch & Ritland (1999), Ritland (Ritland 1996), and Queller & Goodnight (1989) were 60 assessed. 61 Results 62 Statistical descriptors to detect sex-biased dispersal 63 As shown in Table S2, we found a signficantly positive FIS for the males, indicative of a Wahlund effect 64 and as expected for the dispersing sex, which comprises both residents and immigrants. The FIS for 65 females was not statistically significant, but the higher expected heterozygosity (HE) compared to the 66 observed heterozygosity (HO) might result from the pooling together of philopatric females from 67 different mtDNA lineages, or from the sampling bias correction applied to HE. Also in line with a 68 model of male-biased dispersal, the mean corrected assignment index (mAIc) for the males was 69 significantly lower than that of females. However, the higher variance in the corrected assignment 70 index (vAIc) for males was not statistically significant. Thus, these results alone are not conclusive. 71 Marker informativeness and estimator performance 72 We assessed the informativeness of each marker in discriminating relatedness categories and 73 estimating relatedness. Based on the IR ranking, we further conducted iterative simulations of dyads 74 of different relationship categories to analyze the power discrimination of different marker sets. As 75 illustrated in Figure S1, our results show that the set of 7-8 markers with highest IR are very powerful 76 in discriminating parent-offspring (PO) dyads from unrelated pairs (U). 77 In terms of estimator performance, our results indicate that the multilocus reciprocal of the mean 78 squared deviations (RMSD) is highest for the Lynch & Li (LL) and Wang (W) estimators, pointing to 79 their higher precision, compared to the Lynch & Ritland (LR), Queller & Goodnight (QG) and Ritland 80 (R) estimators, in estimating relatedness. The RMSD per marker for each estimator is provided in 81 Table S4. 82 83 84 85 86 87 88 89 90 91 92 93 94 95 96 97 98 99 100 101 102 103 104 105 106 107 108 109 110 111 112 113 114 115 116 117 118 119 120 121 122 123 References Arora N, Nater A, van Schaik CP, et al. (2010) Effects of Pleistocene glaciations and rivers on the population structure of Bornean orangutans (Pongo pygmaeus). Proc Natl Acad Sci U S A 107, 21376-21381. Belkhir K, Borsa P, Chikhi L, Raufaste N, Bonhomme F (1996-2004) GENETIX 4.05, logiciel sous Windows TM pour la génétique des populations, Laboratoire Génome, Populations, Interactions, CNRS UMR 5000, Université de Montpellier II, Montpellier, France. Csillery K, Johnson T, Beraldi D, et al. (2006) Performance of marker-based relatedness estimators in natural populations of outbred vertebrates. Genetics 173, 2091-2101. Goudet J (1995) FSTAT (Version 1.2): A computer program to calculate F-statistics. Journal of Heredity 86, 485-486. Goudet J, Perrin N, Waser P (2002) Tests for sex-biased dispersal using bi-parentally inherited genetic markers. Mol Ecol 11, 1103-1114. Hall TA (1999) BioEdit: a user-friendly biological sequence alignment editor and analysis program for Windows 95/98/NT. Nucleic Acids Symp Ser 41, 95-98. Kalinowski S, Taper M (2006) Maximum likelihood estimation of the frequency of null alleles at microsatellite loci. Conserv Genet 7, 991-995. Li CC, Weeks DE, Chakravarti A (1993) Similarity of DNA fingerprints due to chance and relatedness. Hum Hered 43, 45-52. Lynch M (1988) Estimation of relatedness by DNA fingerprinting. Mol Biol Evol 5, 584-599. Lynch M, Ritland K (1999) Estimation of pairwise relatedness with molecular markers. Genetics 152, 1753-1766. Queller DC, Goodnight KF (1989) ESTIMATING RELATEDNESS USING GENETIC-MARKERS. Evolution 43, 258-275. Raymond M, Rousset F (1995) GENEPOP (Version 1.2): A population genetic software for exact test and ecumenicism. J Heredity 86, 248-249. Ritland K (1996) Estimators for pairwise relatedness and individual inbreeding coefficients. Genetical Research 67, 175-185. Rousset F (2008) GENEPOP ' 007: a complete re-implementation of the GENEPOP software for Windows and Linux. Mol Ecol Resour 8, 103-106. Thompson JD, Higgins DG, Gibson TJ (1994) CLUSTAL W: improving the sensitivity of progressive multiple sequence alignment through sequence weighting, position-specific gap penalties and weight matrix choice. Nucleic Acids Res 22, 4673-4680. Van de Casteele T, Galbusera P, Matthysen E (2001) A comparison of microsatellite-based pairwise relatedness estimators. Mol Ecol 10, 1539-1549. Wang J (2002) An estimator for pairwise relatedness using molecular markers. Genetics 160, 12031215. Wang J (2006) Informativeness of genetic markers for pairwise relationship and relatedness inference. Theor Popul Biol 70, 300-321. Warren KS, Verschoor EJ, Langenhuijzen S, et al. (2001) Speciation and intrasubspecific variation of Bornean orangutans Pongo pygmaeus pygmaeus. Mol Biol Evol 18, 471-480.
