Venn Diagrams & Set Operations Worksheet
3.3 B Notes: Venn Diagrams and Properties of Set Operations
The rectangular region of a Venn diagram represents the Universal Set (or population). Set A divides the universal set. One region represents region A and another is the elements of not in A.
A
𝑨
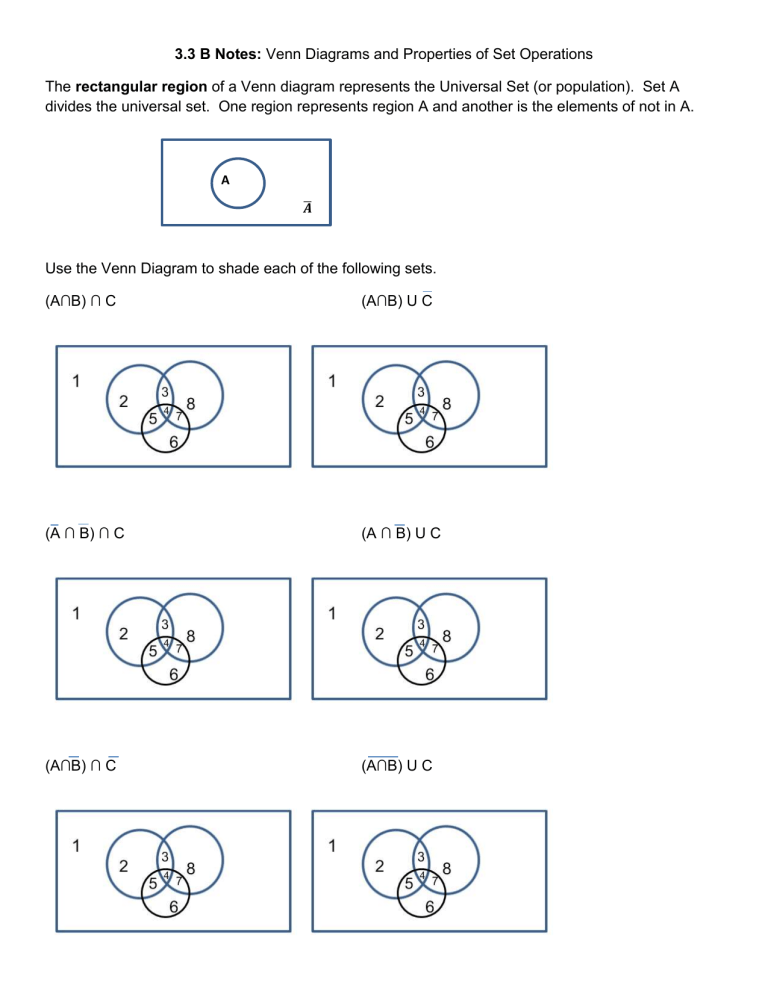
Use the Venn Diagram to shade each of the following sets.
(A∩B) ∩ C (A∩B) U C
(A ∩ B) ∩ C (A ∩ B) U C
(A∩B) ∩ C (A∩B) U C
Name: ________________________________________ Period: _____
142 people were surveyed to determine their cooking habits. The following are the results of the survey.
58 use microwaves
63 use electric ranges
1.) Complete the Venn Diagram
17 use microwave and gas ranges
4 use both gas and electric ranges
58 use gas ranges 1 uses a microwave, gas, and electric
19 use microwave and electric 2 cook with solar energy ovens.
2.) How many people used: a. A microwave or gas range b. Electric and Microwave c. Something other than a gas range d. Neither a gas nor an electric range
3.) One person is randomly selected. Find the following probabilities
Let E=Electric, G = Gas, and M = Microwave a. P(E ∩G) = d. P(only E) = e. P( M
∩ G) = b. P(M U G) = c. P(E U G) = f. P(G ∩ E) =
