EXAMINING THE EFFECT OF OUTLIERS
advertisement

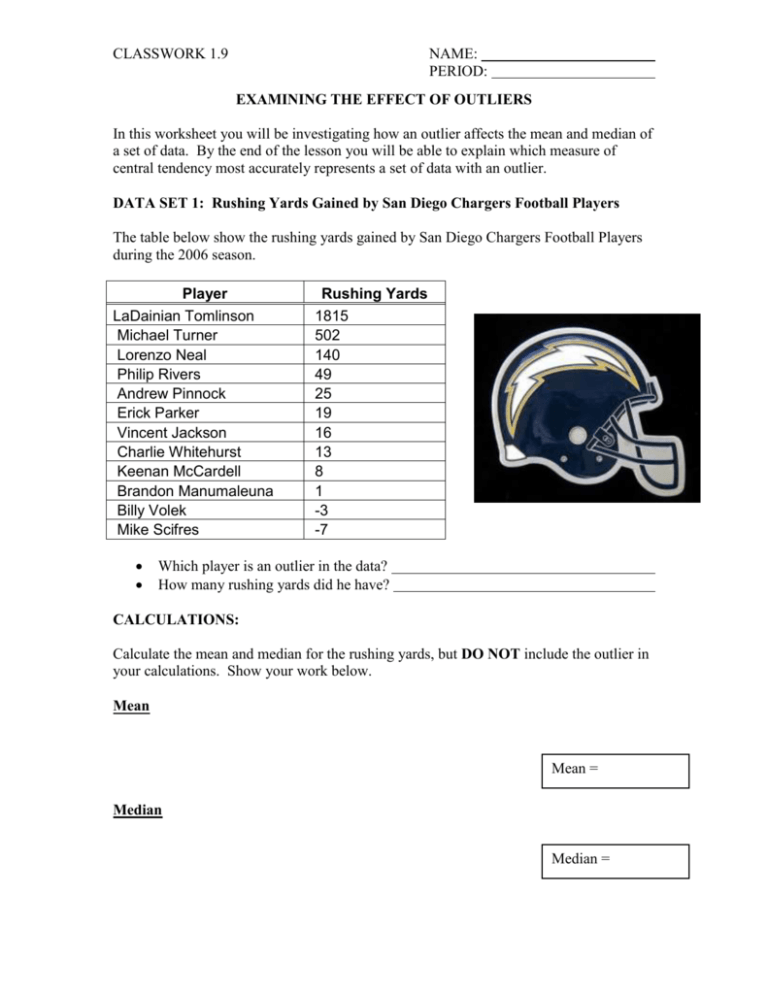
CLASSWORK 1.9 NAME: PERIOD: EXAMINING THE EFFECT OF OUTLIERS In this worksheet you will be investigating how an outlier affects the mean and median of a set of data. By the end of the lesson you will be able to explain which measure of central tendency most accurately represents a set of data with an outlier. DATA SET 1: Rushing Yards Gained by San Diego Chargers Football Players The table below show the rushing yards gained by San Diego Chargers Football Players during the 2006 season. Player LaDainian Tomlinson Michael Turner Lorenzo Neal Philip Rivers Andrew Pinnock Erick Parker Vincent Jackson Charlie Whitehurst Keenan McCardell Brandon Manumaleuna Billy Volek Mike Scifres Rushing Yards 1815 502 140 49 25 19 16 13 8 1 -3 -7 Which player is an outlier in the data? How many rushing yards did he have? CALCULATIONS: Calculate the mean and median for the rushing yards, but DO NOT include the outlier in your calculations. Show your work below. Mean Mean = Median Median = CLASSWORK 1.9 NAME: PERIOD: Now, recalculate the mean and median for the rushing yards, but this time INCLUDE the outlier in your calculations. Show your work below. Mean Mean = Median Median = SUPPORTING QUESTIONS: Answer all supporting questions in complete sentences and justify your answers by referring back to your calculations. 1) Look at your calculations for the mean and median when you DID NOT include the outlier. How many players had a rushing total that was less than the mean? How many players had a rushing total that was greater than the mean? How many players had a rushing total that was less than the median? How many players had a rushing total that was greater than the median? 2) Look at your calculations for the mean and median when you DID include the outlier. How many players had a rushing total that was less than the mean? How many players had a rushing total that was greater than the mean? How many players had a rushing total that was less than the median? How many players had a rushing total that was greater than the median? 3) Look at your answers for questions #1 and #2. If you wanted to accurately represent the number of yards that a TYPICAL San Diego Charger gained rushing, should you use the mean or the median to report the data? Justify your answer with supporting details. CLASSWORK 1.9 NAME: PERIOD: DATA SET 2: Populations of the 10 Largest Cities in Maryland The table below shows the populations of the 10 largest cities in Maryland City Baltimore Columbia Silver Spring Dundalk Wheaton-Glenmont Ellicott City Germantown Bethesda Frederick Gaithersburg Population 651,154 88,254 76,540 62,306 57,694 56,397 55,419 55,277 52,816 52,455 Which city is an outlier in the data? What is the population? CALCULATIONS: Calculate the mean and median for the populations, but DO NOT include the outlier in your calculations. Show your work below. Mean Mean = Median Median = Now, recalculate the mean and median for the populations, but this time INCLUDE the outlier in your calculations. Show your work below. Mean Mean = CLASSWORK 1.9 NAME: PERIOD: Median Median = Finally, calculate how the outlier affected your mean and median. Calculate the difference between the second calculations and the first calculations. Mean (Mean with outlier – Mean without outlier) Difference Between Mean Populations = Median (Median with outlier – Median without outlier) Difference Between Median Populations = SUPPORTING QUESTIONS: Answer all supporting questions in complete sentences and justify your answers by referring back to your calculations. 1) Look at your calculations for the difference between the two mean populations. Did the outlier have a significant effect on the value of the mean population? If so, what was the effect? 2) Look at your calculations for the difference between the two median populations. Did the outlier have a significant effect on the value of the median population? If so, what was the effect? 3) Look at your answers for questions #1 and #2. Summarize how an outlier affects the mean and median of a set of data. CLASSWORK 1.9 NAME: PERIOD: DATA SET 3: Gross Domestic Product (GDP) of the 10 wealthiest countries Record the name of each country and the GDP Report the GDP in billions. For example (United States), $11,667,515,000,000.00 would be 11,667 billion dollars. For another example (Spain), $991,442,000,000.00 would be 991 billion dollars Country GDP (in billions of dollars Which country is an outlier in the data? What is the GDP of that country? CALCULATIONS: Calculate the mean and median for the GDP, but DO NOT include the outlier in your calculations. Show your work below. Mean Mean = Median Median = CLASSWORK 1.9 NAME: PERIOD: Now, recalculate the mean and median for the GDP, but this time INCLUDE the outlier in your calculations. Show your work below. Mean Mean = Median Median = SUPPORTING QUESTIONS: Answer all supporting questions in complete sentences and justify your answers by referring back to your calculations. 1) Look at your calculations for the mean and median when you DID NOT include the outlier. How many countries had a GDP less than the mean GDP? How many countries had a GDP greater than the mean GDP? How many countries had a GDP less than the median GDP? How many countries had a GDP greater than the median GDP? 2) Look at your calculations for the mean and median when you DID include the outlier. How many countries had a GDP less than the mean GDP? How many countries had a GDP greater than the mean GDP? How many countries had a GDP less than the median GDP? How many countries had a GDP greater than the median GDP? 3) Look at your answers for questions #1 and #2. When the GDP of the United States is included in the calculations, which measure of central tendency (mean or median) most accurately represents the GDP of a TYPICAL country in the top ten? CLASSWORK 1.9 NAME: PERIOD: CONCLUDING QUESTIONS: Now that you have examined three sets of data you are ready to make some general conclusions. Answer each question in complete sentences and justify your answer by referring back to calculations you made with the data sets. 1) When there is an outlier in a data set, how is the value of the mean affected? How is the value of the median affected? Does the outlier have a greater affect on the mean or the median? Remember to justify your answer with examples from your calculations. 2) You want to accurately represent a typical number in a data set. If there is an outlier in the data, which measure of central tendency (mean or median) should you use to represent the data? BONUS: In all our data sets the outlier was significantly higher than the rest of the data points. An outlier can also be a data point that is significantly lower than the rest of the data. How do you think that an outlier that is lower than the rest of the data will affect the mean? How will it affect the median?


