14. For each of these statements, define a population and state how
advertisement
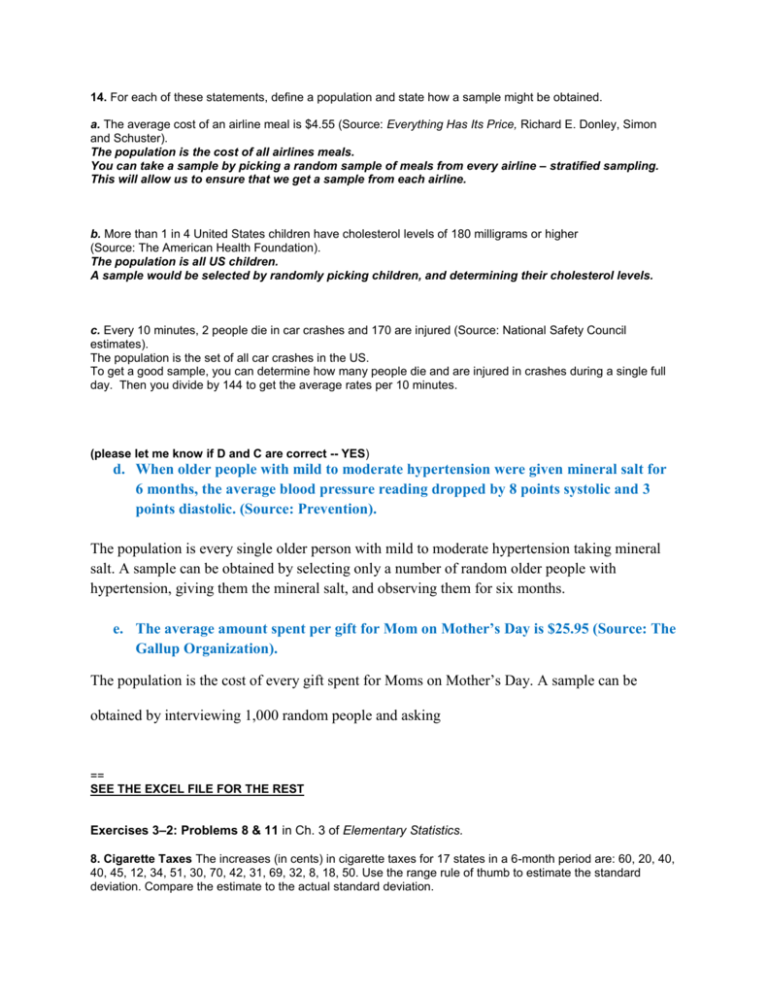
14. For each of these statements, define a population and state how a sample might be obtained. a. The average cost of an airline meal is $4.55 (Source: Everything Has Its Price, Richard E. Donley, Simon and Schuster). The population is the cost of all airlines meals. You can take a sample by picking a random sample of meals from every airline – stratified sampling. This will allow us to ensure that we get a sample from each airline. b. More than 1 in 4 United States children have cholesterol levels of 180 milligrams or higher (Source: The American Health Foundation). The population is all US children. A sample would be selected by randomly picking children, and determining their cholesterol levels. c. Every 10 minutes, 2 people die in car crashes and 170 are injured (Source: National Safety Council estimates). The population is the set of all car crashes in the US. To get a good sample, you can determine how many people die and are injured in crashes during a single full day. Then you divide by 144 to get the average rates per 10 minutes. (please let me know if D and C are correct -- YES) d. When older people with mild to moderate hypertension were given mineral salt for 6 months, the average blood pressure reading dropped by 8 points systolic and 3 points diastolic. (Source: Prevention). The population is every single older person with mild to moderate hypertension taking mineral salt. A sample can be obtained by selecting only a number of random older people with hypertension, giving them the mineral salt, and observing them for six months. e. The average amount spent per gift for Mom on Mother’s Day is $25.95 (Source: The Gallup Organization). The population is the cost of every gift spent for Moms on Mother’s Day. A sample can be obtained by interviewing 1,000 random people and asking == SEE THE EXCEL FILE FOR THE REST Exercises 3–2: Problems 8 & 11 in Ch. 3 of Elementary Statistics. 8. Cigarette Taxes The increases (in cents) in cigarette taxes for 17 states in a 6-month period are: 60, 20, 40, 40, 45, 12, 34, 51, 30, 70, 42, 31, 69, 32, 8, 18, 50. Use the range rule of thumb to estimate the standard deviation. Compare the estimate to the actual standard deviation. 11. Stories in the Tallest Buildings The number of stories in the 13 tallest buildings for two different cities is listed below. Which set of data is more variable? Houston: 75, 71, 64, 56, 53, 55, 47, 55, 52, 50, 50, 50, 47 Pittsburgh: 64, 54, 40, 32, 46, 44, 42, 41, 40, 40, 34, 32, 30 Source: World Almanac. == Exercises 3.22 & 3.23 in Ch. 3 of Introductory Statistics. 3.22 The Tri-City School District has instituted a zero-tolerance policy for students carrying any objects that could be used as weapons. The following data give the number of students suspended during each of the past 12 weeks for violating this school policy. 15 9 12 11 7 6 9 10 14 3 6 5 Calculate the mean, median, and mode for these data. 3.23 The following data represent the numbers of tornadoes that touched down during 1950 to 1994 in the 12 states that had the most tornadoes during this period (Storm Prediction Center, 2009). The data for these states are given in the following order: CO, FL, IA, IL, KS, LA, MO, MS, NE, OK, SD, TX. 1113 2009 1374 1137 2110 1086 1166 1039 1673 2300 1139 5490 a. Calculate the mean and median for these data. b. Identify the outlier in this data set. Drop the outlier and recalculate the mean and median. Which of these two summary measures changes by a larger amount when you drop the outlier? c. Which is the better summary measure for these data, the mean or the median? Explain.
