Math 227 Review Chapters 7-8 Key The graph to the right is the
advertisement
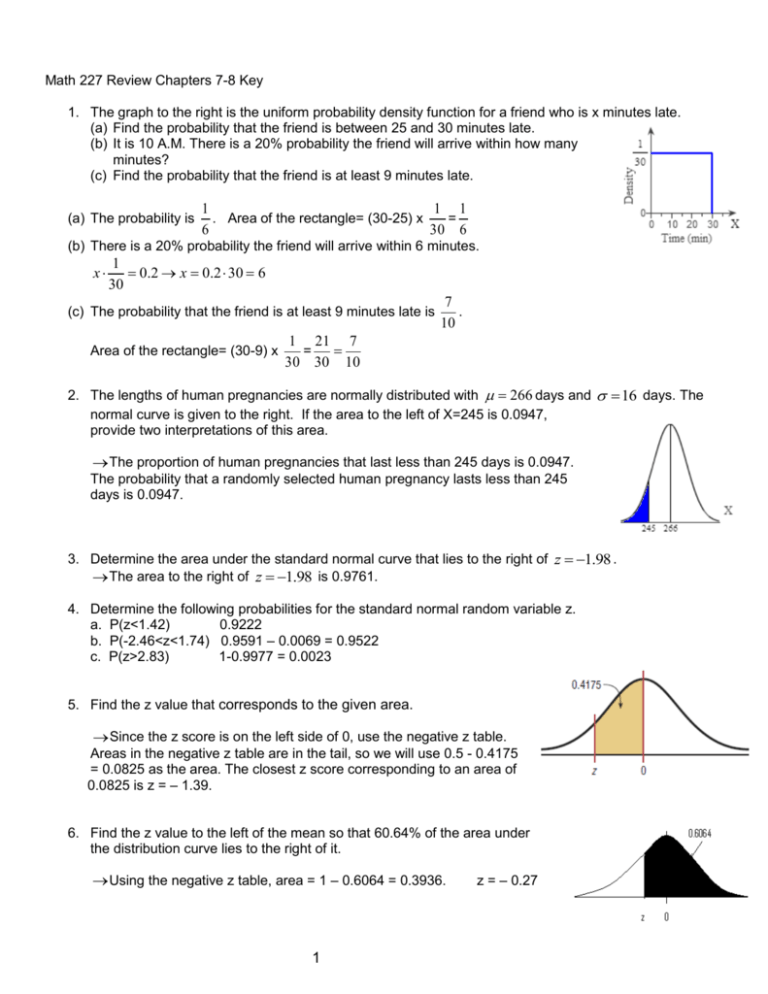
Math 227 Review Chapters 7-8 Key 1. The graph to the right is the uniform probability density function for a friend who is x minutes late. (a) Find the probability that the friend is between 25 and 30 minutes late. (b) It is 10 A.M. There is a 20% probability the friend will arrive within how many minutes? (c) Find the probability that the friend is at least 9 minutes late. (a) The probability is 1 1 1 . Area of the rectangle= (30-25) x = 6 30 6 (b) There is a 20% probability the friend will arrive within 6 minutes. x 1 0.2 x 0.2 30 6 30 (c) The probability that the friend is at least 9 minutes late is Area of the rectangle= (30-9) x 7 . 10 1 21 7 = 30 30 10 2. The lengths of human pregnancies are normally distributed with 266 days and 16 days. The normal curve is given to the right. If the area to the left of X=245 is 0.0947, provide two interpretations of this area. The proportion of human pregnancies that last less than 245 days is 0.0947. The probability that a randomly selected human pregnancy lasts less than 245 days is 0.0947. 3. Determine the area under the standard normal curve that lies to the right of z 1.98 . The area to the right of z 1.98 is 0.9761. 4. Determine the following probabilities for the standard normal random variable z. a. P(z<1.42) 0.9222 b. P(-2.46<z<1.74) 0.9591 – 0.0069 = 0.9522 c. P(z>2.83) 1-0.9977 = 0.0023 5. Find the z value that corresponds to the given area. Since the z score is on the left side of 0, use the negative z table. Areas in the negative z table are in the tail, so we will use 0.5 - 0.4175 = 0.0825 as the area. The closest z score corresponding to an area of 0.0825 is z = – 1.39. 6. Find the z value to the left of the mean so that 60.64% of the area under the distribution curve lies to the right of it. Using the negative z table, area = 1 – 0.6064 = 0.3936. 1 z = – 0.27 7. Find two z values, one positive and one negative, so that the areas in the two tails total 5%. For total area = 0.05, there will be area = 0.025 in each tail. The z scores are 1.96. 8. Assume the random variable X is normally distributed with 50 and standard deviation 7 . Find the 81st percentile. Round your answer to two decimal places as needed. The corresponding z value for the area of 0.81 is 0.88. Using the formula, x z x z 50 0.88(7) 56.16 . The 81st percentile is 56.16. 9. Americans drank an average of 23.2 gallons of bottled water per capita in 2004. If the standard deviation is 2.7 gallons and the variable is normally distributed, find the probability that a randomly selected American drank more than 25 gallons of bottled water. What is the probability that the selected person drank between 18 and 26 gallons? 23.2, 2.7 For x 25 gallons: 25 23.2 0.67; the corresponding area=0.7486 2.7 P( z 0.67) 1 0.7486 0.2514 z For 18 x 26 gallons: 18 23.2 z 1.93; the corresponding area=0.0268 2.7 26 23.2 z 1.04; the corresponding area=0.8508 2.7 P(18 x 1.04) 0.8508 0.0268 = 0.824 0.67 -1.93 1.04 10. The mean incubation time for a type of fertilized egg kept at 100.1 F is 22 days. Suppose that the incubation times are approximately normally distribution with a standard deviation of 1 day. Would it be unusually for an egg to hatch in less than 20. 5 days? Why or why not? P( x 20.5) P( z 1.5) 0.0668 . The probability of this event is 0.0668, so it would not be unusual because the probability is greater than 0.05. 11. To qualify for security officers’ training, recruits is tested for stress tolerance. The scores are normally distributed, with a mean of 62 and a standard deviation of 8. If only the top 15% of recruits are selected, find the cutoff score. 2 62, 8 1 0.15 0.85 The corresponding z score is 1.04 x Cutoff z x z 62 1.04 8 70.32 12. An automobile dealer finds that the average price of a previously owned vehicle is $8256. He decides to sell cars that will appeal to the middle 60% of the market in terms of price. Find the maximum and minimum prices of the cars the dealer will sell. The standard deviation is $1150, and the variable is normally distributed. $8256, $1150 . The middle 60% means that 30% of the area will be on either side of the mean. The corresponding z score is found using area = 0.20. The z scores are 0.84. Min z 8256 (0.84) *1150 $7290 Max z 8256 0.84*1150 $9222 13. The time required for an automotive center to complete an oil change service on an automobile approximately follows a normal distribution, with a mean of 21 minutes and a standard deviation of 5 minutes. (a) The automotive center guarantees customers that the service will take no longer than 23 minutes. If it does take longer, the customer will receive the service for half-price. What percent of customers receive the service for half-price? (b) If the automotive center does not want to give the discount to more than 4% of its customers, how long should it make the guaranteed time limit? Round your answer up to the nearest minutes. (a) The percent of customers that receive the service for half-price is 34.46%. P( x 23) P( z 0.4) 1 0.6554 0.3446 (b) The guaranteed time limit is 30 minutes. The corresponding z-value for the area of 0.96 is 1.75. x z 21 1.75(5) 29.75 30 14. Determine whether the normal probability plot to the right indicates that the sample data could have come from a population that is normally distributed. The relation is not linear, so the sample data could not have come from a population that is normally distributed. 15. A population has 37 and 6 . For a random sample of size n=6, a. Determine the mean of the sample means. x 37 b. Determine the standard deviation of the sample means. x n 6 2.449 2.45 6 16. The average number of pounds of meat that a person consumes a year is 218.4 pounds. Assume that the standard deviation is 25 pounds and the distribution is approximately normal. 3 a. Find the probability that a person selected at random consumes less than 224 pounds per year. 218.4, 25; P( x 224) P( z 0.22) 0.5871 b. If a sample of 40 individuals is selected, find the probability that the mean of the sample will be less than 224 pounds per year. 25 x 218.4, x 3.95; P ( x 224) P ( z 1.42) 0.9222 40 17. Suppose the lengths of the pregnancies of a certain animal are approximately normally distributed with mean of 222 days and standard deviation of 22 days. (a) What is the probability that a randomly selected pregnancy lasts less than 214 days? (b) What is the probability that a random sample of 15 pregnancies has a mean gestation period of less than 214 days? (c) What is the probability that a random sample of 43 pregnancies has a mean gestation period of less than 214 days? (a) P ( x 214) P ( z 0.36) 0.3594 (b) P( x 214) P( z 1.41) 0.0793 (c) P ( x 224) P ( z 2.38) 0.0087 18. The sample proportion, denoted p̂ , is given by the formula p̂ = individuals with a specified characteristic in a sample of n x , where x n is the number of individuals. 19. According to a survey in a country, 22% of adults do not have any credit cards. Suppose a simple random sample of 500 adults is obtained. (a) Describe the sampling distribution of p̂ , the sample proportion of adults who do not have a credit card. (b) Determine the mean and the standard deviation of the sampling distribution of p̂ . (c) In a random sample of 500 adults, what is the probability that less than 20% have no credit cards? (d) Would it be unusual if a random sample of 500 adults results in 125 or more having no credit cards? (a) The shape of the sampling distribution of p̂ np(1 p) 500 .22 1 .22 10 . , the shape of the sampling distribution of (b) Mean is approximately normal because n 0.05 N np(1 p) 10 . (For a simple random sample size n such that p̂ is approximately normal provided p 0.22, p 0.019, (c) The probability is 0.1469. P ( p 0.20) P ( z 1.05) 0.1469 (d) The result is not unusual because the probability that p̂ is greater than or equal to this sample proportion is greater than 5%. P ( p 0.25) P ( z 1.58) 1 0.9429 0.0571 20. According to a study conducted by a statistical organization, the proportion of Americans who are satisfies with the way things are going in their lives is 0.82. Suppose that a random sample of 110 Americans is obtained. (a) Describe the sampling distribution of p̂ . (b) Determine the mean and the standard deviation of the sampling distribution of p̂ . (c) What is the probability that at least 82 Americans in the sample are satisfied with their lives? 4 (d) What is the probability that 79 or fewer Americans in the sample are satisfied with their lives? p̂ is approximately normal because np(1 p) 110(0.82)(1 0.82) 10 . (For a simple random sample size n such that n 0.05 N , the shape of the sampling distribution of p̂ is approximately normal provided np(1 p) 10 . (b) Mean p 0.82, p 0.037, (a) The shape of the sampling distribution of (c) The probability is 0.9706. P ( p 0.75) P ( z 1.89) 1 0.0294 0.9706 (d) The probability is 0.0035. P ( p 0.72) P ( z 2.75) 0.0035 5


