Name: Date: __________Period/#:__:____ Local Geography and
advertisement
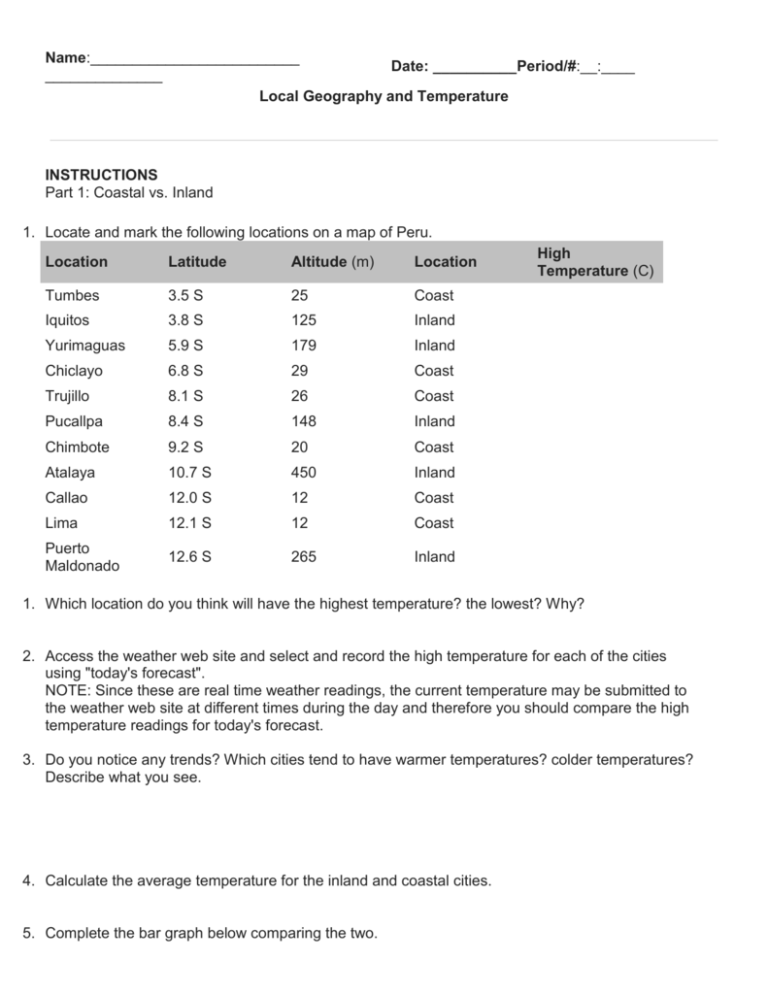
Name:_________________________ Date: __________Period/#:__:____ ______________ Local Geography and Temperature INSTRUCTIONS Part 1: Coastal vs. Inland 1. Locate and mark the following locations on a map of Peru. Location Latitude Altitude (m) Location Tumbes 3.5 S 25 Coast Iquitos 3.8 S 125 Inland Yurimaguas 5.9 S 179 Inland Chiclayo 6.8 S 29 Coast Trujillo 8.1 S 26 Coast Pucallpa 8.4 S 148 Inland Chimbote 9.2 S 20 Coast Atalaya 10.7 S 450 Inland Callao 12.0 S 12 Coast Lima 12.1 S 12 Coast Puerto Maldonado 12.6 S 265 Inland High Temperature (C) 1. Which location do you think will have the highest temperature? the lowest? Why? 2. Access the weather web site and select and record the high temperature for each of the cities using "today's forecast". NOTE: Since these are real time weather readings, the current temperature may be submitted to the weather web site at different times during the day and therefore you should compare the high temperature readings for today's forecast. 3. Do you notice any trends? Which cities tend to have warmer temperatures? colder temperatures? Describe what you see. 4. Calculate the average temperature for the inland and coastal cities. 5. Complete the bar graph below comparing the two. 1. Why do you think one of the locations was on average warmer or colder than the other? 2. Based on your observations above, do you think soil or water will heat up faster? why? Part 2: Heat Capacity of the Earth's Surfaces 1. Cut the following data table and tape it into your SJ: Time (min.) Soil Temperature (C) Start 1 2 3 4 5 6 7 8 9 10 Water Temperature (C) 1. 2. 3. 4. DIRECTIONS Fill the two clear narrow glasses / beakers with equal volumes of water (at room temperature) and soil and place the thermometers in each at equal depths and locations. Note: the thermometers should be suspended so as not to touch the bottom or sides of the glasses and should be covered by a minimum of .5 cm. Arrange the glasses / beakers at equal distances beneath the heat sources and record the initial temperatures of the soil and water in your data table. Turn on the heat source and record your measurements every minute for 10 minutes. Draw two line graphs comparing the change in Soil Temperature and the change in Water Temperature over Time in the graph below. Don't forget to label each of the lines to distinguish between the two graphs. 1. Do you notice any trends? Which had the greatest increase in temperature? 2. Calculate the total change in temperature for the soil and water: _______ C 3. What would you expect to observe if you recorded the temperature over time as the water and soil cool down? Why? Part 3: Analyze the Data 1. Based on the experiment you just completed, what conclusions can you make about which material heated up faster? 2. Which material do you expect would cool off faster if you recorded the temperature after you turned the heat source off? why? 3. What do you think is responsible for the differences in temperature between the coastal cities and the Inland cities? why? 4. How do your observations from the two experiments compare with your hypothesis? Homework 1. List at least one additional factor that might influence the temperatures of the cities. Describe how you might measure it. 2. Based on your analysis and assuming all other weather factors remained constant (same latitude, etc.), which of the two cities below would have a more moderate temperature? why? Huacho (Latitude: 11.1 S, Elevation: 67m, Location: Coast) Esperanza (Latitude: 9.8 S, Elevation: 253m, Location: Inland)
