TECHNICAL ANALYSIS
advertisement
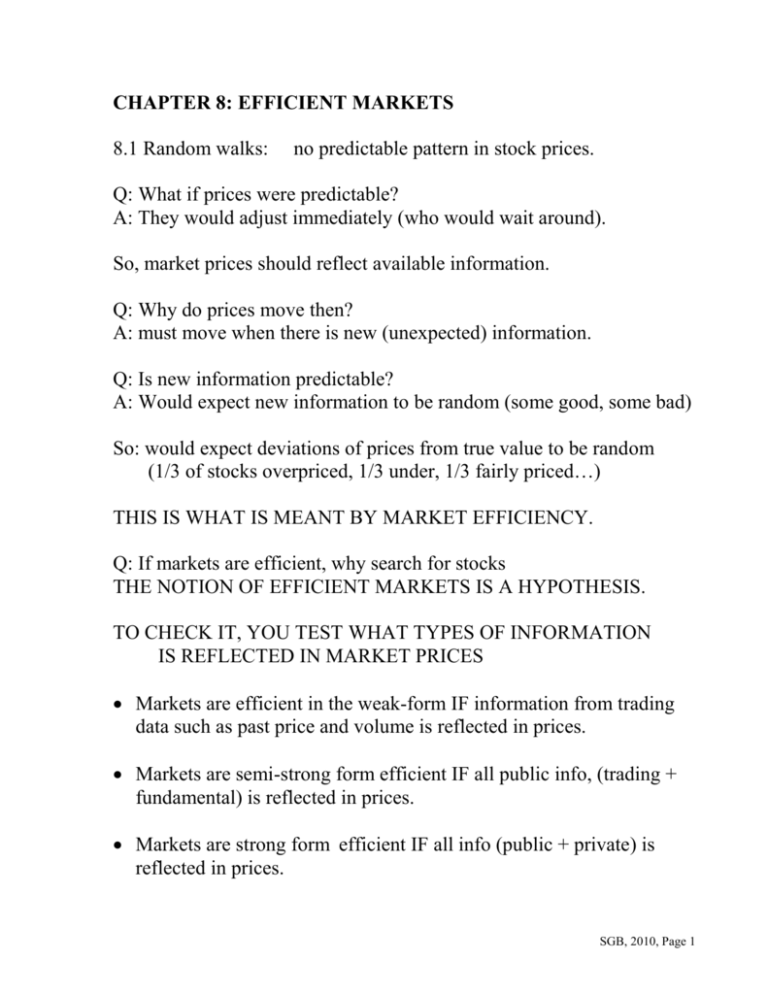
CHAPTER 8: EFFICIENT MARKETS 8.1 Random walks: no predictable pattern in stock prices. Q: What if prices were predictable? A: They would adjust immediately (who would wait around). So, market prices should reflect available information. Q: Why do prices move then? A: must move when there is new (unexpected) information. Q: Is new information predictable? A: Would expect new information to be random (some good, some bad) So: would expect deviations of prices from true value to be random (1/3 of stocks overpriced, 1/3 under, 1/3 fairly priced…) THIS IS WHAT IS MEANT BY MARKET EFFICIENCY. Q: If markets are efficient, why search for stocks THE NOTION OF EFFICIENT MARKETS IS A HYPOTHESIS. TO CHECK IT, YOU TEST WHAT TYPES OF INFORMATION IS REFLECTED IN MARKET PRICES Markets are efficient in the weak-form IF information from trading data such as past price and volume is reflected in prices. Markets are semi-strong form efficient IF all public info, (trading + fundamental) is reflected in prices. Markets are strong form efficient IF all info (public + private) is reflected in prices. SGB, 2010, Page 1 8.2 IMPLICATIONS OF THE E-M-H. If prices reflect available information and new information affects prices randomly THEN: You wouldn’t expect people to generate risk-adjust alpha’s consistently. A: Technical analysis Technical analysts look at past trading data, prices, volumes, odd lots, short interest etc to develop trading strategies. IF these trading strategies are successful (i.e they generate positive risk adjusted alpha) => markets not efficient in the weak form. B: Fundamental analyis. Fundamental analysts look at financial statements, earnings, dividends, interest rates, risk etc and develop fair values for stock prices based on some sort of DCF or relative value analysis. IF their trading strategies are consistently successful THEN markets are not efficient in the semi-strong form. C: Portfolio manager, insiders and others with private information PMs spend resources on information Insiders often know things that are not public. IF even these guys cannot consistently generate risk-adjusted alpha, markets are not efficient in the strong form. SO WHAT IS THE EVIDENCE FOR OR AGAINST THE E-M-H? SGB, 2010, Page 2 8.3 Evidence: Weak form. Insignificant runs and filter rule tests. Insignificant daily return auto-correlation (serial corr) later results positive over short horizons for portfolios (price momentum) but not for individual stocks; negative over long horizons (fads, overreaction). Winner-loser returns and reversals (losers beat winners by a cumulative 25% over 3-years) Other results on D/P, P/E, yield spreads appear to predict retur SO, SHORT RUN => MOMENTUM, LONG RUN => REVERSION 8.3 Evidence: semi-strong form (notion of event studies and abnormal returns) Post-earnings announcement drift (sluggish, slow response) January and tax-loss selling Small firms (outperform 4.3% risk-adjusted) Book-to-market (high performs better). Neglected firms 8.3 Evidence: Strong form Insider trades Value line rankings Fund manager performance At what level of information does this hypothesis break down? SGB, 2010, Page 3 Alternative exposition 1) No group of investors will consistently beat the market (T) 2) No investor will beat the market consistently over any time period (F) 3) Chances of finding an undervalued stock are 50/50 (T) 4) Minimizing trading activity provides superior returns to one that involves trading frequently (T) KEY QUESTION TO ASK: How efficient are markets? NOT Are markets efficient ? Magnitude issue ($ 5million gain on a $ 5 billion portfolio is a lot in dollar terms, not in return terms) Selection bias issue (the good strategies are never made public). Lucky event issue (Warren Buffett??) SGB, 2010, Page 4 CHAPTER 9: TECH ANALYSIS AND BEHAVIORAL FINANCE Rational Economic Man (Woman) makes mistakes !!!! a) people don’t process information correctly b) even if they do, they’re not always consistent/sub-optimal (biases) Q: But why aren’t these errors arbitraged away ? A: there are limits to arbitrage activity, costs of implementation, how long to commit funds, what if the model is wrong. (Many noted short sellers got blown away recently and in the tech bubble). INFO PROCESSING a) Over-weight recent info, underweight past info. (Firms have high P/E due to optimism and is reversed later). b) Overconfidence and optimism: 80% of all drivers feel their driving is above average. Have you ever met an “average” money manager? c) Conservatism: slow to update beliefs and anchoring= refusal to change opinion in the face of new information. d) Tendency to overweight low probability events and underweight high probability events BIASES a) framing (how something is presented affects your decision). b) mental accounting (and the notion of “house” money). c) regret avoidance (losses on a blue-chip stock are bad luck while losses on a risky start-up make you more likely to blame yourself). d) endowment effects: ownership increases your notion of what something is worth. SGB, 2010, Page 5 e) status quo bias and loss aversion (people weight losses much more than gains) leads to a disposition effect (reluctance to take losses and urgency to take gains). Q: Why doesn’t arbitrage work? Limits in that prices may get even more under (or over) priced ! Costs of conducting arbitrage Model risk (important these days). DO BIASES CANCEL OUT? 9.2 TECHNICAL ANALYSIS FOCUS ON SUPPLY/DEMAND CHARACTERISTICS Not on fundamentals, but rational and irrational swings in prices and volumes—behavioral finance. Price adjustment to new information is gradual. View markets as a contest between bulls and bear and TA as indicators of which side is more likely to win. CHARTING (Tradestation) Dow theory, primary (years), secondary (few months), tertiary Bar Charts SGB, 2010, Page 6 Price Charts: arithmetic (y-axis divides equally on price change or log (y-axis divides equally on percentage change), one may signal a trend break and the other may not !!! Volume charts (signal of commitment) and money-flow charts that track volume of trades at the ask (bullish) or bid (bearish). Could supplement these with momentum and relative strength charts as well. Candlestick: open-to-close is rectangle (body), shaded for down days, clear for up days, lines above and below for high and low. SGB, 2010, Page 7 Trends—measure changes to investor expectations Moving average prices represent an average of prices over last “n” days. Each day,the oldest price is dropped and the newest one added. If the current price is above the moving average, => current expectations higher than the past –bullish. By using these, one is more likely to be on the right side of the market but always late !!! The 200 day average is viewed as significant. Support (demand) and resistance (supply) levels – are barriers to changes in expectations SGB, 2010, Page 8 Traders remorse—e.g. after resistance (or a trend) is broken, price goes up for a few days, but market participants change their minds. Creates a “bull trap” when price moves back to resistance. When do you believe the break? -- Check volume. IF successful, old resistance becomes new support. Head and shoulders, double tops, broadening tops and bottoms all signal trend reversal. Triangles: symmetric implies continuation of preceding trend Flags and pennants, also signs of congestion in a major trend Price Momentum: 10-day momentum is difference between close price today and closing price 10 (or other #) days ago. Can also do as a rate of change (ROC). Instead of price could use other market variables for broader measures of momentum (# of advancing stocks - # of declining stocks). Oscillator: e.g. 10-day moving average of the difference between the # of advancers and the # of decliners. Can also subtract a moving average from price Can also subtract two moving averages (MACD oscillator = 12-day moving average of price MINUS 26-day moving average of price) IF > 0, recent expectations more bullish than older one. SGB, 2010, Page 9 Convergence/Divergence => when the oscillator moves with or differently from the current price. (divergence when price reaches lows while oscillator doesn’t). Overbought/oversold: when prices are too high (low) and subject to a decline (increase). Is a short-term expectation of a reversal and is inferred from extreme movements in oscillators Bollinger Bands: For any moving average, the upper and lower bands are 2-standard deviations above and below. Bands widen (narrow) with increasing (decreasing) volatility. Contrarian indicators Odd-lot trades/mutual fund cash holdings Option put/call ratio (range 0.3 - 0.5 in recent bull markets) Higher => bearish attitude, if contrarian, then this is bullish Advisor opinions Short interest Breadth and Sentiment Indicators High-low index, advances declines index. TRIN = # adv/# declining)/(Vol adv/Vol decl). Trin > 1 is bearish (as more volume in declining stocks). SGB, 2010, Page 10 Confidence index (ratio of avg high grade bond yield to avg intermediate grade bond, higher is bullish) Skill at TA appears to emerge from viewing hundreds of charts and drawing empirical conclusions. Recent study showed that some technical patterns occur more commonly in prices than randomness would suggest. Much more on the NASDAQ than on the NYSE. Profitability in question? SGB, 2010, Page 11
