Supplementary information Figures S1-S6 and Tables S1
advertisement
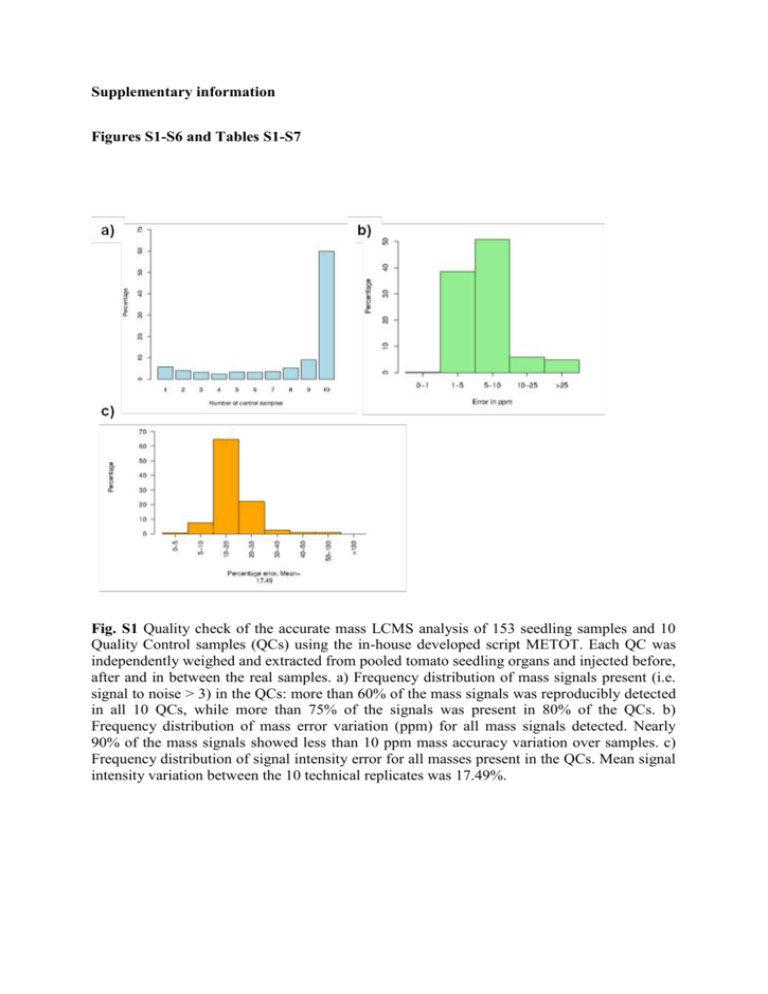
Supplementary information Figures S1-S6 and Tables S1-S7 Fig. S1 Quality check of the accurate mass LCMS analysis of 153 seedling samples and 10 Quality Control samples (QCs) using the in-house developed script METOT. Each QC was independently weighed and extracted from pooled tomato seedling organs and injected before, after and in between the real samples. a) Frequency distribution of mass signals present (i.e. signal to noise > 3) in the QCs: more than 60% of the mass signals was reproducibly detected in all 10 QCs, while more than 75% of the signals was present in 80% of the QCs. b) Frequency distribution of mass error variation (ppm) for all mass signals detected. Nearly 90% of the mass signals showed less than 10 ppm mass accuracy variation over samples. c) Frequency distribution of signal intensity error for all masses present in the QCs. Mean signal intensity variation between the 10 technical replicates was 17.49%. Fig. S2 Accurate mass Orbitrap FTMS fragmentation (negative mode ionization) of chromatographic peaks selected as being specific for a particular tomato seedling organ. a) Fragments obtained after MS2 (=MS/MS) and MS3 analysis of peak h4 (m/z 493.10) particularly abundant in hypocotyls. The MS2 fragmentation shows a main fragment at m/z 331.04 corresponding to methylated myricetin, while the MS3 shows a fragment at m/z 316.02 corresponding to the myricetin aglycon radical. b) Fragments obtained after MS2 and MS3 analysis of peak r11 (m/z 737.32) particularly abundant in roots. c) Fragments obtained by MS2 and MS3 analysis of peak s4 (m/z 1079.53) particularly abundant in seeds. Fig. S3 Accumulation of Quercetin 3-rutinoside per organ per experiment. The mixed model that has been fitted to the data shows that a similar slope and curvature are observed between the three independent experiments (A, B and C) for both cotyledon and hypocotyl organs. Quercetin 3-O-rutinoside was under the limit of detection in the root samples and hence, in this case the model did not fit the data. Fig. S4 Inter-organ comparison of untargeted tomato seedling metabolite profiles. a) Plot representing the metabolic changes during time in cotyledons vs roots. b) Plot representing the metabolic changes during time in hypocotyls vs roots. Metabolites coloured in red are significantly changed in time in both organs analysed (p<0.05); green only significantly different in x-axis organ; blue metabolites are only significantly different in y-axis organ. Metabolites coloured on black did not significantly change during seedling development. Organ-specific compounds are listed in the upper horizontal strip (x-axis organ) or in the vertical strip to the right (y-axis organ). Numbers at metabolite dots refer to the specific number of annotated compound. Fig. S5 Tomato seedling growth under different light conditions. a) Tomato seedlings at d7, grown at different light regimes: Control = 16h light; Dark = transfer to complete darkness at d5; Light = transfer to continuous light at d5. b) Hypocotyl length of tomato seedlings growing under dark, control and 24h light conditions. Arrow indicates the time point that plants were subjected to the different treatments (d5). Elongation values (in cm) correspond to the average and standard deviation of 3 replicate experiments, using 20 seedlings per time point per experiment. Fig. S6 Metabolic changes based on untargeted profiles of seedlings grown at different light conditions. a) Cotyledons 24h light vs. control. b) Cotyledons dark vs. control. c) Hypocotyls 24h light vs. control. d) Hypocotyls dark vs. control. Metabolites coloured in red are significantly changed in time in both conditions analysed (p<0.05); green only significantly different in x-axis condition; blue metabolites are only significantly different in y-axis condition. Metabolites coloured on black did not significantly change during perturbed light conditions. Light-specific compounds are listed in the upper horizontal strip (x-axis condition) or in the vertical strip to the right (y-axis condition). Table S1 Calculation of coefficient of variation (given as % = SDEV/Mean) in hypocotyl length during seedling development. Average (cms) SDV % of var. 5 1.49 0.18 11.81 6 1.78 0.19 10.59 7 2.07 0.18 8.80 8 2.39 0.22 9.25 9 2.67 0.26 9.81 DAS Table S2 Water content (in % of fresh weight) in the different organs of tomato seedlings at different developmental stages. d3 d4 d5 d6 d7 d8 d9 87.2±1.4 91.0±0.9 - - - - - Cotyledons - 91.2±1.5 93.0±0.5 94.1±0.5 94.9±0.4 95.5±0.2 Hypocotyls - 94.4±0.4 96.9±0.4 97.2±1.2 97.3±0.2 97.5±0.3 96.8±0.5 97.4±0.2 97.8±1.7 97.6±1.3 97.6±0.3 Seeds Roots Table S3 Putative annotation of mass signals specifically accumulated on each organ (represented on Fig. 2b). Table S4 Results from mixed model analyses to determine robustness and reproducibility of the system. Given are the number of metabolites selected for analysis, determined by the number of observations beyond the detection threshold (see Exp. Proc.), the percentage of metabolites showing differences in mean level across experiments (element of robustness), the percentage of metabolites showing differences in slope (trend) across experiments (element of robustness), goodness of fit for a common metabolite dependence on time across the three experiments (element of robustness) and coefficient of variation based on standard deviation and mean of three biological replicates at a particular day (element of reproducibility). Cotyledons Hypocotyls Roots 198 59 19 60 24 237 68 13 59 29 217 60 14 44 39 Number of analysed metabolites Metabolites showing differences in mean level (%) Metabolites showing differences in slope (%) Goodness of fit, R2 (median value across metabolites) Coefficient of variation (median value across metabolites) Table S5 Tentative annotation of selected organ-specific metabolites in cotyledons (cot) vs hypocotyls (hyp). Numbers between brackets in the MS/MS-fragments column refer to the relative abundance of the fragment as compared to the base peak (set at 100%, not numbered). Observed [M-H]Only in cotyledons ppm error MS/MS fragments Putative annotation Elemental Formula 431.1931 2.1 385.18, 223.13 (2) Terpene hexose C19H30O8 FA Only in hypocotyls b* 27.01 944.4902 1.5 898.48 Glycoalkaloid (leptinidine) C46H75O19N FA 1.3 916.49 Glycoalkaloid (leptinidine) C46H77O20N FA Code RT a* 19.14 c* 28.83 962.4979 Increase in cot and hyp d* 19.32 381.1774 2.2 249.13 Isopentyl hexose-pentose C16H30O10 e* 18.00 385.1145 1.4 223.06, 247.06 (55), 205.05 (45) Sinapoyl-hexose C17H22O10 Increase in hyp decrease in cot f* 18.03 443.1199 1.1 267.09 Benzyl derivative C19H24O12 1.3 149.04, 311.09 (25) Benzyl derivative C19H28O10 1.6 316.0223, 317.0305 (71) Myricetin -hexose C21H20O13 g* 20.36 415.1622 Decrease in cot and hyp h* 21.55 479.0838 Table S6 Comparison with respect to trend between organs under two different light regimes. Percentage of significantly negative (-), positive (+) and non-significant (NS) results. Numbers of metabolites analysed are indicated in parentheses. Organ cotyledons hypocotyls pair of treatments compared 24hl vs control control vs dark sign difference sign difference + NS + NS 2.9 16.6 80.6 (175) 37.9 9.3 52.8 (182) 0.5 12.9 86.6 (209) 15.1 3.0 81.9% (199) Table S7 Metabolites (flavonols and anthocyanins) varying significantly in cotyledons and hypocotyls samples during light perturbations (dark or 24h light, vs control, p<0.05). Number Annotation id_25 id_36 id_39 id_44 id_29 id_32 h1 h2 id_24 id_40 id_54 id_16 id_55 id_31 h* id_37 id_38 id_42 id_43 id_27 Kaempferol 3-rutinoside-7-glucoside Petunidin 3-(trans-coumaroyl)-rutinoside-5-glucoside Petunidin 3-(feruloyl)-rutinoside-5-glucoside Malvidin 3-(trans-coumaroyl)-rutinoside-5-glucoside Petunidin 3-(caffeoyl)-rutinoside-5-glucoside Delphinidin 3-(trans-coumaroyl)-rutinoside-5-glucoside Petunidin derivative I (H2O) Petunidin derivative II (H2O) kaempferol 3-glucoside-7-glucoside quercetin 3-rutinoside kaempferol-hexose-deoxyhexose, -hexose, -C10H8O3 (176) quercetin 3-rutinoside-7-glucoside myricetin hexose-deoxy-coum quercetin 3-sophoroside myricetin -hexose kaempferol 3-sophoroside isorhamnetin 3-sophoroside isorhamnetin 3-gentiobioside kaempferol-hexose-deoxyhexose, -pentose delphinidin 3-(caffeoyl)-rutinoside-5-glucoside Cotyledons control control vs 24hL vs dark 0.01 0.004 0.01 0.01 0.04 0.05 0.02 0.04 0.04 0.01 0.005 Hypocotyls control control vs 24hL vs dark 0.03 0.01 0.05 0.02 0.03 0.02 0.002 0.004 0.002 0.0001 0.0001 0.03 0.04 0.04 0.02
