Worksheet 1.2 – Graphing (Key Below)
advertisement
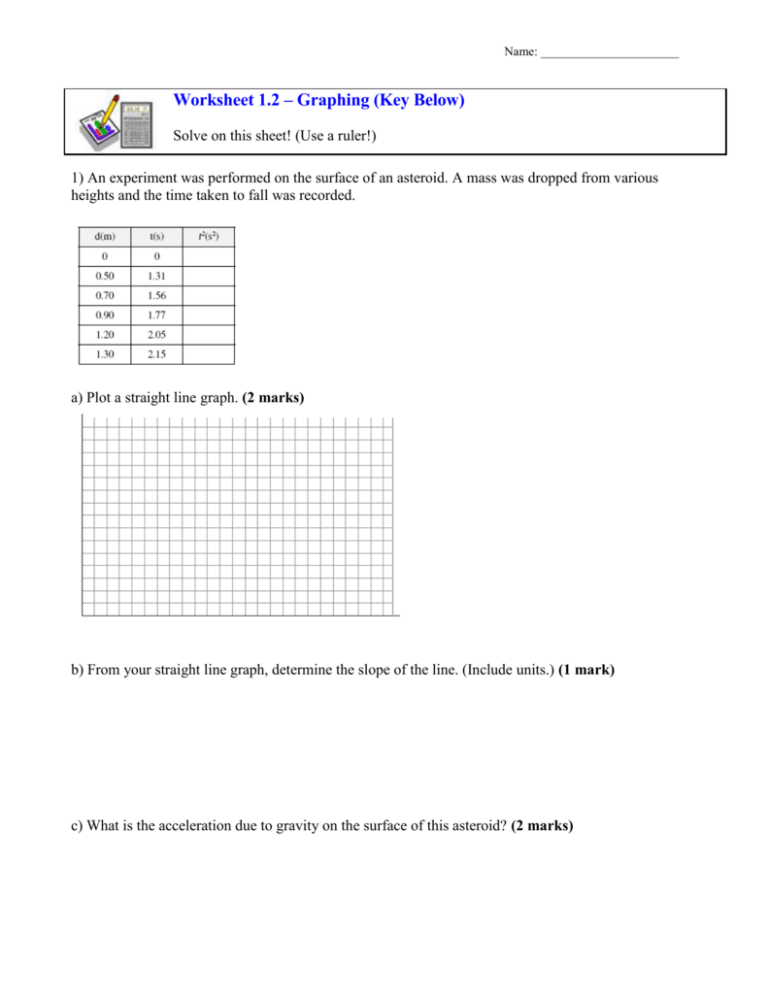
Name: ______________________ Worksheet 1.2 – Graphing (Key Below) Solve on this sheet! (Use a ruler!) 1) An experiment was performed on the surface of an asteroid. A mass was dropped from various heights and the time taken to fall was recorded. a) Plot a straight line graph. (2 marks) b) From your straight line graph, determine the slope of the line. (Include units.) (1 mark) c) What is the acceleration due to gravity on the surface of this asteroid? (2 marks) Name: ______________________ 2) A force (F) was used to pull a wooden block across a floor as shown below. The size of the force was varied and the data table below shows the size of the force and the block’s resulting acceleration. Plot the data on the graph below and draw a line of best fit. Extend the line back to the ‘y’ axis so that you have a y-intercept point and determine the slope of the line. Using your slope value and your y-intercept value from the graph, determine the coefficient of friction between the block and the floor. Name: ______________________ 3) A student measures the final speed of an accelerating car at various displacements. The data collected is shown below. Plot a graph of the final speed squared, v2, versus the displacement, d, of the car on the graph below. Determine the slope of the line of best fit to the data and state what the slope represents. Extend the line to the y-axis and use the y-intercept to determine the initial speed of the car. Name: ______________________ Worksheet 1.2 Answers 1) 2) 3) Name: ______________________


