Listed below are the drinking water contaminants that we detected
advertisement
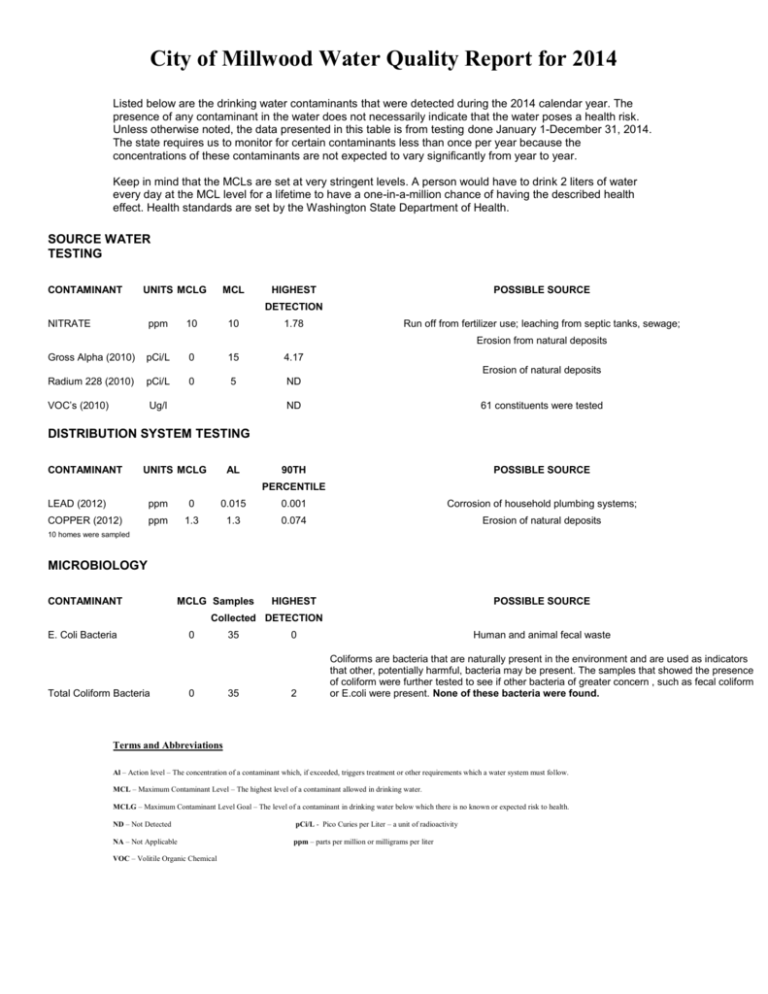
City of Millwood Water Quality Report for 2014 Listed below are the drinking water contaminants that were detected during the 2014 calendar year. The presence of any contaminant in the water does not necessarily indicate that the water poses a health risk. Unless otherwise noted, the data presented in this table is from testing done January 1-December 31, 2014. The state requires us to monitor for certain contaminants less than once per year because the concentrations of these contaminants are not expected to vary significantly from year to year. Keep in mind that the MCLs are set at very stringent levels. A person would have to drink 2 liters of water every day at the MCL level for a lifetime to have a one-in-a-million chance of having the described health effect. Health standards are set by the Washington State Department of Health. SOURCE WATER TESTING CONTAMINANT UNITS MCLG MCL HIGHEST POSSIBLE SOURCE DETECTION NITRATE ppm 10 10 1.78 Gross Alpha (2010) pCi/L 0 15 4.17 Radium 228 (2010) pCi/L 0 5 ND VOC’s (2010) Ug/l Run off from fertilizer use; leaching from septic tanks, sewage; Erosion from natural deposits Erosion of natural deposits ND 61 constituents were tested 90TH POSSIBLE SOURCE DISTRIBUTION SYSTEM TESTING CONTAMINANT UNITS MCLG AL PERCENTILE LEAD (2012) ppm 0 0.015 0.001 Corrosion of household plumbing systems; COPPER (2012) ppm 1.3 1.3 0.074 Erosion of natural deposits HIGHEST POSSIBLE SOURCE 10 homes were sampled MICROBIOLOGY CONTAMINANT MCLG Samples Collected DETECTION E. Coli Bacteria Total Coliform Bacteria 0 0 35 35 0 Human and animal fecal waste 2 Coliforms are bacteria that are naturally present in the environment and are used as indicators that other, potentially harmful, bacteria may be present. The samples that showed the presence of coliform were further tested to see if other bacteria of greater concern , such as fecal coliform or E.coli were present. None of these bacteria were found. Terms and Abbreviations Al – Action level – The concentration of a contaminant which, if exceeded, triggers treatment or other requirements which a water system must follow. MCL – Maximum Contaminant Level – The highest level of a contaminant allowed in drinking water. MCLG – Maximum Contaminant Level Goal – The level of a contaminant in drinking water below which there is no known or expected risk to health. ND – Not Detected pCi/L - Pico Curies per Liter – a unit of radioactivity NA – Not Applicable ppm – parts per million or milligrams per liter VOC – Volitile Organic Chemical City of Millwood Water Quality Report for 2014 Water Use Efficiency (WUE) Report The Municipal Water Supply Efficiency Requirements Act, known as the Municipal Water Law, adopted in 2003 requires the City of Millwood to adopt a water conservation program which will: Publicly establish water saving goals specifically directed towards their customers Evaluate or implement specific water saving measures to achieve customer goals Develop a WUE planning program to support the established goals Meet a 10% water loss standard Report annually on progress towards achieving goals and water loss The City of Millwood has set a goal to reduce average water consumption by 1% annually to the year 2016. Reduction of water use will be achieved through consumer education using a variety of means including the Mayors’ newsletters, the electronic message board and utility bill inserts. The total pumped for 2014 increased by 14.7 million gallons from the previous year but could have been the result of warmer than normal temperatures and increased flushing from the construction project. Even with higher production than normal and higher usages by the customers we were able to reduce our distribution leakage by 3.4 percent from last year. Examples of efficiency measures achieved through education include: Better irrigation practices: turning off sprinklers when it rains; avoid over watering, installing a rain sensor on sprinkler systems Turn off the tap when brushing teeth and while washing dishes Installation of low flow toilets, dual-flush toilets and low flow shower heads Total Water Produced (water pumped) Authorized Consumption (metered water and calculated flushing) System Leakage (unmetered water and leaks) 225,954,000 gallons 169,426,624 gallons 52,575,477 gallons The City replaced approximately 2000 linear feet of distribution main in 2014. The City also repaired several leaks in service lines and continues to survey for additional leaks. Our goal is to reduce leakage to below 10 percent by 2016. Sprinkler Systems All sprinkler systems require backflow protection. Please check your system to see that it has an approved backflow device. If you install backflow protection, please contact the Millwood Water Department to be sure you have a correct device and that it is properly installed. Backflow installation and testing are mandatory State regulations. The City staff will be conducting site surveys throughout the year to update our database records. Questions regarding this report or for changes in billing, contact: City of Millwood 9103 E. Frederick Spokane ,Wa. 99206 (509) 924-0960 Office hours: 8:00 a.m. – noon and 1 p.m.-5 p.m. Mon. –Fri. City Council Meetings are held every second Tuesday at 7:00 p.m.
