Digitizing and scale
advertisement
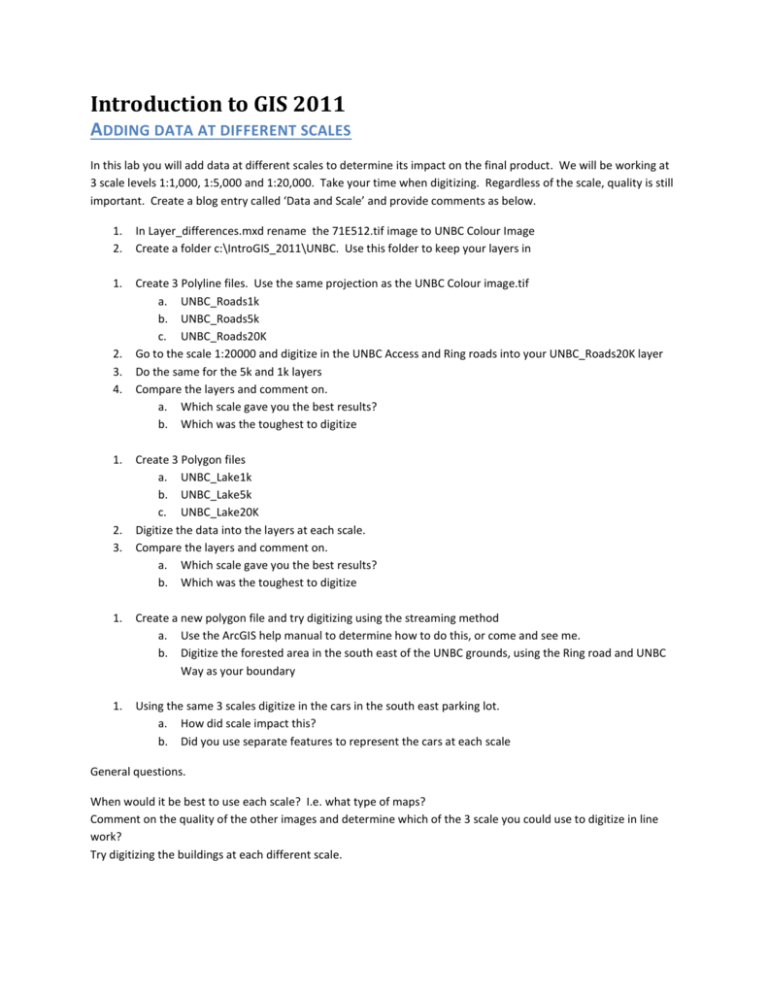
Introduction to GIS 2011 ADDING DATA AT DIFFERENT SCALES In this lab you will add data at different scales to determine its impact on the final product. We will be working at 3 scale levels 1:1,000, 1:5,000 and 1:20,000. Take your time when digitizing. Regardless of the scale, quality is still important. Create a blog entry called ‘Data and Scale’ and provide comments as below. 1. 2. In Layer_differences.mxd rename the 71E512.tif image to UNBC Colour Image Create a folder c:\IntroGIS_2011\UNBC. Use this folder to keep your layers in 1. Create 3 Polyline files. Use the same projection as the UNBC Colour image.tif a. UNBC_Roads1k b. UNBC_Roads5k c. UNBC_Roads20K Go to the scale 1:20000 and digitize in the UNBC Access and Ring roads into your UNBC_Roads20K layer Do the same for the 5k and 1k layers Compare the layers and comment on. a. Which scale gave you the best results? b. Which was the toughest to digitize 2. 3. 4. 1. 2. 3. Create 3 Polygon files a. UNBC_Lake1k b. UNBC_Lake5k c. UNBC_Lake20K Digitize the data into the layers at each scale. Compare the layers and comment on. a. Which scale gave you the best results? b. Which was the toughest to digitize 1. Create a new polygon file and try digitizing using the streaming method a. Use the ArcGIS help manual to determine how to do this, or come and see me. b. Digitize the forested area in the south east of the UNBC grounds, using the Ring road and UNBC Way as your boundary 1. Using the same 3 scales digitize in the cars in the south east parking lot. a. How did scale impact this? b. Did you use separate features to represent the cars at each scale General questions. When would it be best to use each scale? I.e. what type of maps? Comment on the quality of the other images and determine which of the 3 scale you could use to digitize in line work? Try digitizing the buildings at each different scale.

