Revised Correctional Industries
advertisement
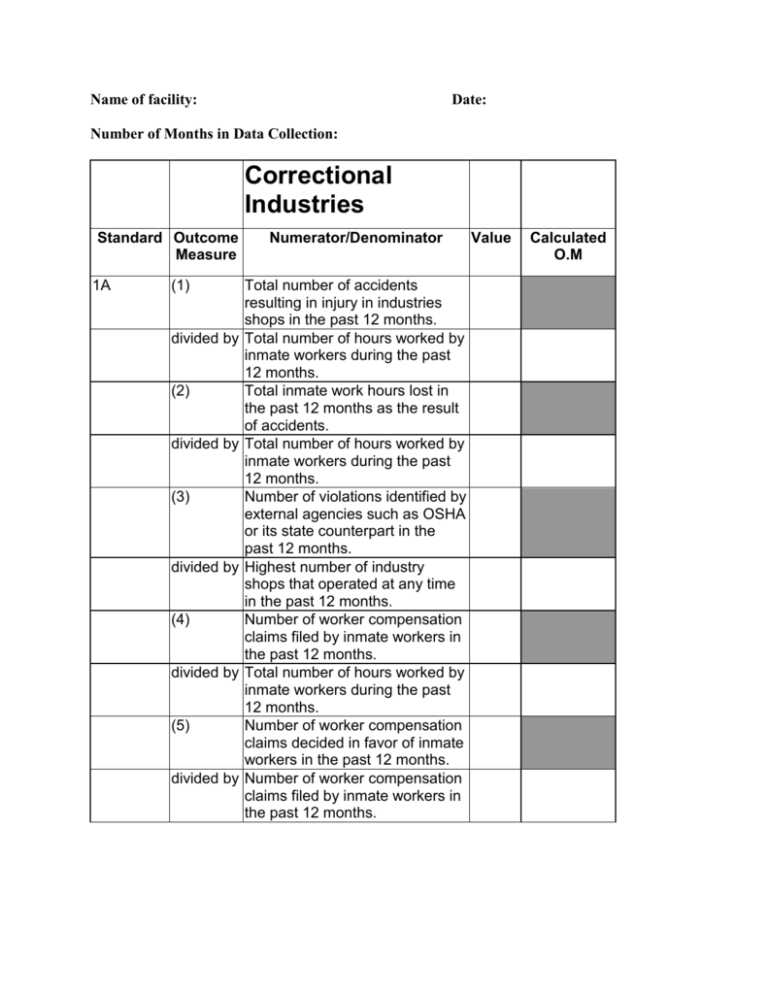
Name of facility: Date: Number of Months in Data Collection: Correctional Industries Standard Outcome Measure 1A (1) divided by (2) divided by (3) divided by (4) divided by (5) divided by Numerator/Denominator Total number of accidents resulting in injury in industries shops in the past 12 months. Total number of hours worked by inmate workers during the past 12 months. Total inmate work hours lost in the past 12 months as the result of accidents. Total number of hours worked by inmate workers during the past 12 months. Number of violations identified by external agencies such as OSHA or its state counterpart in the past 12 months. Highest number of industry shops that operated at any time in the past 12 months. Number of worker compensation claims filed by inmate workers in the past 12 months. Total number of hours worked by inmate workers during the past 12 months. Number of worker compensation claims decided in favor of inmate workers in the past 12 months. Number of worker compensation claims filed by inmate workers in the past 12 months. Value Calculated O.M (6) Number of worker compensation claims filed by correctional industries staff, volunteers and contractors in the past 12 months. divided by Total number of hours worked by inmate workers during the past 12 months. (7) 1B Number of worker compensation claims filed by correctional industries staff, volunteers and contractors resolved in favor of the complainant in the past 12 months. divided by Number of worker compensation claims filed by correctional industries staff, volunteers and contractors in the past 12 months. (1) Number of emergency events that interrupted production in the past 12 months. divided by Total number of hours worked by inmate workers during the past 12 months. (2) Number of hours that industry operations were suspended due to industry emergency events in the past 12 months. divided by Number of emergency events in the past 12 months. (3) Total time between start of emergency events and appropriate response in the past 12 months. divided by Number of emergencies in industries in the past 12 months. 2A (1) Number of security events that interrupted production in the past 12 months. divided by Total number of hours worked by inmate workers during the past 12 months. (2) Total number of inmate work divided by 2B (1) (2) divided by (3) (4) divided by 2C (1) divided by 3A (1) hours lost due to security events in the past 12 months. Total number of hours worked by inmate workers during the past 12 months. Number of times serious contraband was discovered in work areas in the past 12 months. Number of times serious contraband was discovered in work areas in the past 12 months. Total number of industries shops that operated in the past 12 months. Number of times other contraband was discovered in work areas in the past 12 months. Number of times other contraband was discovered in work areas in the past 12 months. Total number of industries shops that operated in the past 12 months. Number of incidents in which information or operating system security was breeched in the past 12 months. Total number of hours worked by inmate workers during the past 12 months. Number of inmate workplace violations in the past 12 months. divided by Total number of hours worked by inmate workers during the past 12 months. (2) Number of inmates terminated from industries due to workplace violations in the past 12 months. divided by Total number of hours worked by inmate workers during the past 12 months. 4A (1) divided by (2) divided by (3) divided by (4) divided by 5A (1) Number of inmate workers who found employment upon release in the past 12 months. Number of inmate workers who were released in the past 12 months. Number of inmate workers who received vocational and/or educational training during or prior to assignment to industries. Number of inmate workers who were assigned to industries in the past 12 months. Number of competency certificates awarded to inmate workers in the past 12 months. Number of inmate workers assigned to industries in the past 12 months. Average number of hours per week shops were open in the past 12 months. 40 hours. Number of grievances pertaining to industries resolved in favor of inmates in the past 12 months. divided by Total number of hours worked by inmate workers during the past 12 months. (2) Total number of inmate grievances pertaining to industries in the past 12 months resolved in favor of inmates. divided by Total number of inmate grievances pertaining to industries in the past 12 months. (3) Total number of inmate court suits alleging violation of inmate rights pertaining to industries resolved in favor of inmates in the past 12 months. 6A divided by Total number of hours worked by inmate workers during the past 12 months. (4) Total number of inmate court suits alleging violation of inmate rights pertaining to industries resolved in favor of inmates in the past 12 months. divided by Total number of inmate court suits alleging violation of inmate rights pertaining to industries filed in the past 12 months. (1) Number of adverse legal findings against correctional industries in the past 12 months. (2) Cost of warrantee repairs in the past 12 months. divided by Total sales for the past 12 months. (3) Number of customer complaints in the past 12 months. divided by Number of customer complaints for the previous 12 months. (4) 6B Number of on-time deliveries in the past 12 months. divided by Number of deliveries in the past 12 months. (5) Total hours industry operations were suspended in the past 12 months due to physical plant events divided by Total number of hours worked by inmate workers during the past 12 months. (6) Total number of lost work hours due to inmate callouts in the past 12 months. divided by Total number of hours worked by inmate workers during the past 12 months. (1) Total number of inmate work hours lost in the past 12 months due to searches. 6C divided by Total number of hours worked by inmate workers during the past 12 months. (2) Total number of inmate work hours lost in the past 12 months due to security measures such as counts and lockdowns. divided by Total number of hours worked by inmate workers during the past 12 months. (3) Number of awards and recognition from external sources in the past 12 months. (4) Number of positive media coverage items relating to correctional industries in the past 12 months. (1) Number of individual correctional industries staff that left correctional industries employment for any reason in the past 12 months. divided by Average number of full-time equivalent correctional industries staff positions in the past 12 months. (2) Average number of full-time equivalent correctional industries staff employed in the past 12 months. divided by Average number of full-time equivalent correctional industries staff authorized in the past 12 months. (3) Total number of professional development training credit hours earned by correctional industries staff participating in higher education in the past 12 months. divided by Average number of full-time equivalent correctional industries staff employed in the past 12 months. (4) Number of disciplinary actions against staff in the past 12 months. divided by Average number of full-time equivalent correctional industries staff employed in the past 12 months. (5) Number of staff who received unsatisfactory performance evaluations in the past 12 months. divided by Number of staff who were evaluated. (6) Number of staff, volunteer or contractor drug tests which were positive. divided by Number of drug tests administered. (7) Number of workplace complaints filed against correctional industries by staff, volunteers and contractors in the past 12 months. divided by Average number of full-time equivalent correctional industries staff employed in the past 12 months. (8) Number of workplace complaints resolved against industries in the past 12 months. divided by Number of workplace complaints filed against industries. 6D (1) Number of complaints filed by staff in the past 12 months. divided by Number of full-time equivalent correctional industries staff employed in the past 12 months. (2) Number of complaints filed by staff in the past 12 months which were found to have merit. divided by Number of complaints filed by staff in the past 12 months. 6E (1) (2) Number of material audit findings by an independent financial auditor at the conclusion of the last audit. Number of inventory turns. (3) 6F 6G Average days of sales in receivables (ADSR). (4) Accuracy (percentage) of inventory. (1) Number of outcome measures that showed a positive change in the past 12 months when compared to the previous 12 months. divided by 53 (total number of outcome measures). (1) Number of findings of PIECP noncompliance in the past 12 months. divided by Total number of hours worked by inmates in PIECP programs.
