1
Richard P. Ebstein, Mikhail M. Monakhov, Yunfeng Lu, Yushi Jiang, Poh San Lai,
Soo Hong Chew. Dopamine D2 Receptor gene is Associated with Economic Risk
Attitude measured by Experimental Games in a Large Sample of Han Chinese.
SUPPLEMENTARY INFORMATION
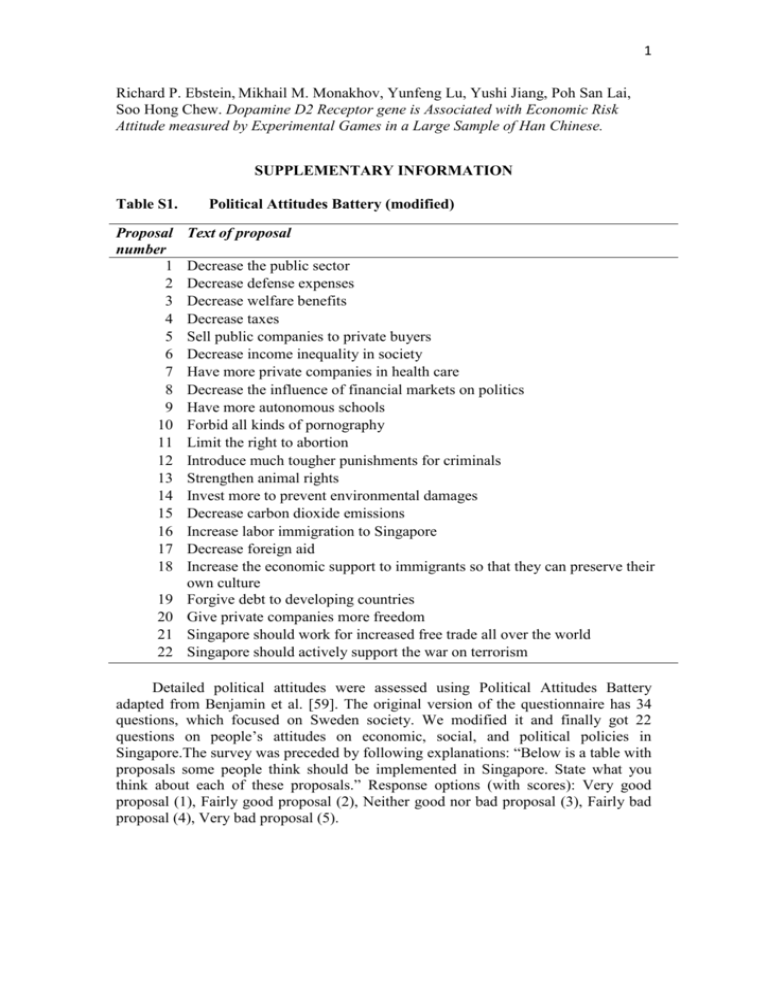
Table S1.
Proposal
number
1
2
3
4
5
6
7
8
9
10
11
12
13
14
15
16
17
18
19
20
21
22
Political Attitudes Battery (modified)
Text of proposal
Decrease the public sector
Decrease defense expenses
Decrease welfare benefits
Decrease taxes
Sell public companies to private buyers
Decrease income inequality in society
Have more private companies in health care
Decrease the influence of financial markets on politics
Have more autonomous schools
Forbid all kinds of pornography
Limit the right to abortion
Introduce much tougher punishments for criminals
Strengthen animal rights
Invest more to prevent environmental damages
Decrease carbon dioxide emissions
Increase labor immigration to Singapore
Decrease foreign aid
Increase the economic support to immigrants so that they can preserve their
own culture
Forgive debt to developing countries
Give private companies more freedom
Singapore should work for increased free trade all over the world
Singapore should actively support the war on terrorism
Detailed political attitudes were assessed using Political Attitudes Battery
adapted from Benjamin et al. [59]. The original version of the questionnaire has 34
questions, which focused on Sweden society. We modified it and finally got 22
questions on people’s attitudes on economic, social, and political policies in
Singapore.The survey was preceded by following explanations: “Below is a table with
proposals some people think should be implemented in Singapore. State what you
think about each of these proposals.” Response options (with scores): Very good
proposal (1), Fairly good proposal (2), Neither good nor bad proposal (3), Fairly bad
proposal (4), Very bad proposal (5).
2
Table S2.
Distribution of political attitude categories
Males
Females
N
%
8
0.9
Combined
N
%
14
0.8
N
6
%
0.7
Conservative
107
12.1
114
12.8
221
12.5
Middle-of-the-road
381
43.2
462
52
843
47.6
Liberal
325
36.8
275
30
600
33.9
Highly liberal
64
7.2
29
3.3
93
5.2
Total
883
100
888
100
1771
100
Highly conservative
Subjects were asked following question: “In terms of politics, you consider
yourself as:” Permitted responses were: “very conservative” (score 1),
“conservative” (score 2), “middle-of-the-road” (score 3), “liberal” (score 4),
“very liberal” (score 5), “others” (with a field to type in the specific opinion)
and “don’t know”. Subjects choosing “others” and “don’t know” were
excluded from the analysis (N = 325).
3
Table S3.
Effects of sex and age on political attitudes
(1)
Coeff.
sex
age
(2)
Odds
Ratio
Coeff.
(3)
Odds
Ratio
0.698***
0.360***
(6.3e-05)
Coeff.
Odds
Ratio
0.670***
0.400***
(7.0e-05)
0.039
1.040
(.22)
-0.030
0.971
(.4)
N
1771
1769
1769
Ordered logistic regression. Odds ratios indicate odds of being in higher political
attitude category with one unit increase of independent variable Sex = 1 for males and 2
for females. p-values in parentheses. * p < 0.10, ** p < 0.05, *** p < 0.01. Higher values
of political ideology scale correspond to liberal attitude.
4
Table S4.
traits
Associations between political attitudes and Big Five personality
Combined
-0.018**
(2.1e-02)
Males
-0.003
(.77)
Females
-0.032***
(3.0e-03)
-0.002
(.72)
-0.004
(.65)
-0.0001
(.99)
Openness
0.036***
(3.5e-10)
0.040***
(5.0e-07)
0.031***
(1.7e-04)
Agreeableness
-0.033***
(9.0e-09)
-0.027***
(4.3e-04)
-0.038***
(6.8e-06)
-0.011
(.11)
-0.009
(.43)
-0.014
(.15)
Neuroticism
Extraversion
Conscientiousness
-0.283**
(1.5e-02)
N
1257
601
656
Ordered logistic regression of political attitude score on personality traits. Higher
values of political ideology scale correspond to liberal attitude. Sex = 1 for males and 2
for females. p-values in parentheses. * p < 0.10, ** p < 0.05, *** p < 0.01
sex
5
Table S5.
Associations between political attitudes and TCI personality traits
Combined
Males
Females
-0.007
(.25)
-0.011
(.2)
-0.005
(.59)
Reward Dependence
-0.013**
(3.1e-02)
-0.013
(.14)
-0.014
(.12)
Novelty Seeking
0.032***
(1.7e-06)
0.028***
(5.8e-03)
0.035***
(1.1e-04)
Persistence
0.010*
(7.0e-02)
0.008
(.26)
0.012
(.16)
Self-Transcendence
-0.018***
(3.5e-03)
-0.020**
(2.3e-02)
-0.017*
(6.2e-02)
Self-Directedness
-0.013**
(3.1e-02)
-0.022**
(1.7e-02)
-0.006
(.46)
Cooperativeness
-0.008
(.17)
-0.005
(.57)
-0.011
(.17)
Harm Avoidance
sex
-0.256*
(5.2e-02)
N
959
454
505
Ordered logistic regression of political attitude score on personality traits. Higher
values of political ideology scale correspond to liberal attitude. Sex = 1 for males and 2
for females. p-values in parentheses. * p < 0.10, ** p < 0.05, *** p < 0.01.
6
Table S6.
Genotypes and alleles frequencies of DRD4 exon III VNTR
Genotype
2R/2R
N
102
2R/3R
5.76
Alleles
2R
N
773
%
21.8
2
0.11
3R
26
0.7
2R/4R
551
31.11
4R
2656
75.0
2R/5R
11
0.62
5R
64
1.8
2R/6R
5
0.28
6R
17
0.5
3R/3R
1
0.06
7R
4
0.1
3R/4R
22
1.24
8R
1
0.03
4R/4R
1010
57.03
9R
1
0.03
4R/5R
49
2.77
4R/6R
9
0.51
4R/7R
4
0.23
4R/8R
1
0.06
5R/5R
2
0.11
6R/6R
1
0.06
6R/9R
1
0.06
761
43.0
1771
100
Genotypes other
than 4R/4R
Total:
%
7
Table S7.
Attitudes
DRD4
sex
N
Attitudes
DRD4
sex
N
Effects of DRD4 on responses to Political Attitudes Battery
(1)
(2)
(3)
(4)
(5)
(6)
Question
Question Question Question Question Question
1
2
3
4
5
6
(7)
Question
7
(8)
Question
8
(9)
Question
9
(10)
Question
10
(11)
Question
11
1.068
(0.118)
1.075
(0.121)
1,178
1.052
(0.113)
1.748***
(0.192)
1,178
0.826*
(0.091)
1.428***
(0.160)
1,178
1.044
(0.112)
0.699***
(0.077)
1,178
1.185
(0.128)
0.914
(0.101)
1,178
1.242**
(0.137)
0.974
(0.109)
1,178
1.010
(0.109)
1.316**
(0.143)
1,178
1.069
(0.118)
1.486***
(0.168)
1,178
1.332***
(0.147)
1.563***
(0.173)
1,178
0.956
(0.104)
0.386***
(0.042)
1,178
1.125
(0.120)
0.642***
(0.070)
1,178
(1)
Question
12
(2)
Question
13
(3)
Question
14
(4)
Question
15
(5)
Question
16
(6)
Question
17
(7)
Question
18
(8)
Question
19
(9)
Question
20
(10)
Question
21
(11)
Question
22
1.058
(0.115)
1.084
(0.118)
1,178
1.320**
(0.146)
0.466***
(0.052)
1,178
1.307**
(0.148)
0.629***
(0.071)
1,178
1.351***
(0.151)
0.606***
(0.069)
1,178
1.074
(0.116)
1.016
(0.111)
1,178
0.981
(0.110)
1.210*
(0.133)
1,178
1.105
(0.120)
0.778**
(0.085)
1,178
1.110
(0.120)
0.710***
(0.080)
1,178
0.938
(0.104)
1.166
(0.132)
1,178
1.081
(0.121)
1.470***
(0.169)
1,178
0.996
(0.107)
1.602***
(0.172)
1,178
All coefficients are reported in odds ratios. “Very good” is coded as 1, “fairly good proposal” is coded as 2, “neither good or bad proposal” is
coded as 3, “fairly bad proposal” is coded as 4, and “very bad proposal” is coded as 5. DRD4 = 1 if DRD4 exon III VNTR genotype is 4R/4R
and DRD4 = 0 for all other genotypes. Sex = 1 for males and 2 for females. Standard deviations are in parentheses. * means p < 0.10, ** means p
< 0.05, *** means p < 0.01.
8
Table S8.
Distribution of subjects by Number of Friends
Males
Females
Combined
Number of friends
N
%
N
%
N
%
no friends
22
2.49
2
0.23
24
1.36
1-2
172
19.48
144
16.22
316
17.84
3-5
471
53.34
505
56.87
976
55.11
6-9
141
15.97
177
19.93
318
17.96
10 or more
77
8.72
60
6.76
137
7.74
Total
883
100
888
100
1771
100
9
Table S9.
Regressions of political ideology on DRD4, sex and number of friends
(1)
DRD4
(2)
Coef.
-0.2
OR
0.82
**
**
Coef.
-0.19**
-0.36***
OR
0.82
Coef.
0.208
OR
1.231
(3.2e-02)
0.7
(4)
(5)
Coef.
-.12
OR
.88
Coef.
0.45
OR
1.56
**
(2.8e-02)
sex
(3)
.55
-0.36***
0.7
***
-0.358***
(0.25)
0.699***
-.36***
(.13)
.69***
-0.15
0.86
***
(7.8e-05)
(6.9e-05)
(7.4e-05)
(6.1e-05)
(.28)
-0.38**
DRD4 × sex
0.68
**
(3.6e-02)
Number of friends (ordinal)
0.01
1
0.071
(.94)
Number of friends (binary)
1.07
(.33)
0.1
1.11
.24*
(.3)
DRD4 × Number of friends
(ordinal)
-0.129
OR – odds ratio.
0.23
1.26
(.11)
0.88
.21
DRD4 × Number of friends
(binary)
Log likelihood
N
1.27*
(8.5e-02)
-.26
-2066.452
1771
-2065.958
1771
-2065.131
1771
.76
-0.25
0.78
(.18)
(.21)
-2065.1309
1771
-2062.919
1771
10
DRD4 exon III
VNTR (4R/4R
genotype)
sex
0.490
(.37)
-0.321
(.57)
0.575
(.32)
0.289
(.6)
Conscientiousness
Agreeableness
Openness
Extraversion
Association between DRD4 gene and NEO-PI-R personality traits
Neuroticism
Table S10.
-0.116
(.83)
4.894***
0.798
2.172***
3.364***
-3.444***
(1.4e-18)
(.16)
(1.5e-04)
(2.7e-09)
(5.5e-10)
N
1257
1257
1257
1257
1257
Linear regression. DRD4 = 1 if DRD4 exon III VNTR genotype is 4R/4R and DRD4
= 0 for all other genotypes. Sex = 1 for males and 2 for females. p-values in
parentheses. * p < 0.1, ** p < 0.05, *** p < 0.01.
11
5.990*** 4.478*** 2.752***
(2.9e-08) (9.4e-08) (4.1e-04)
-1.084
(.18)
-4.618*** 1.623**
(5.3e-06) (4.4e-02)
Cooperativeness
-0.296
(.77)
SelfTranscendence
-0.096
(.9)
Self-Directedness
sex
-0.968
(.25)
Persistence
0.281
(.79)
Novelty Seeking
DRD4
Reward
Dependence
Association between DRD4 gene and TCI-R personality traits
Harm Avoidance
Table S11.
1.315
(.21)
-0.387
(.67)
-1.647
(.12)
3.219***
(4.3e-04)
959
959
959
959
959
959
959
N
Linear regression. DRD4 = 1 if DRD4 exon III VNTR genotype is 4R/4R and DRD4
= 0 for all other genotypes. Sex = 1 for males and 2 for females. p-values in
parentheses. * p < 0.1, ** p < 0.05, *** p < 0.01.
12
Figure S1. Distributions of responses to questions about environmental issues


