Population - Uruguay & Jordan
advertisement

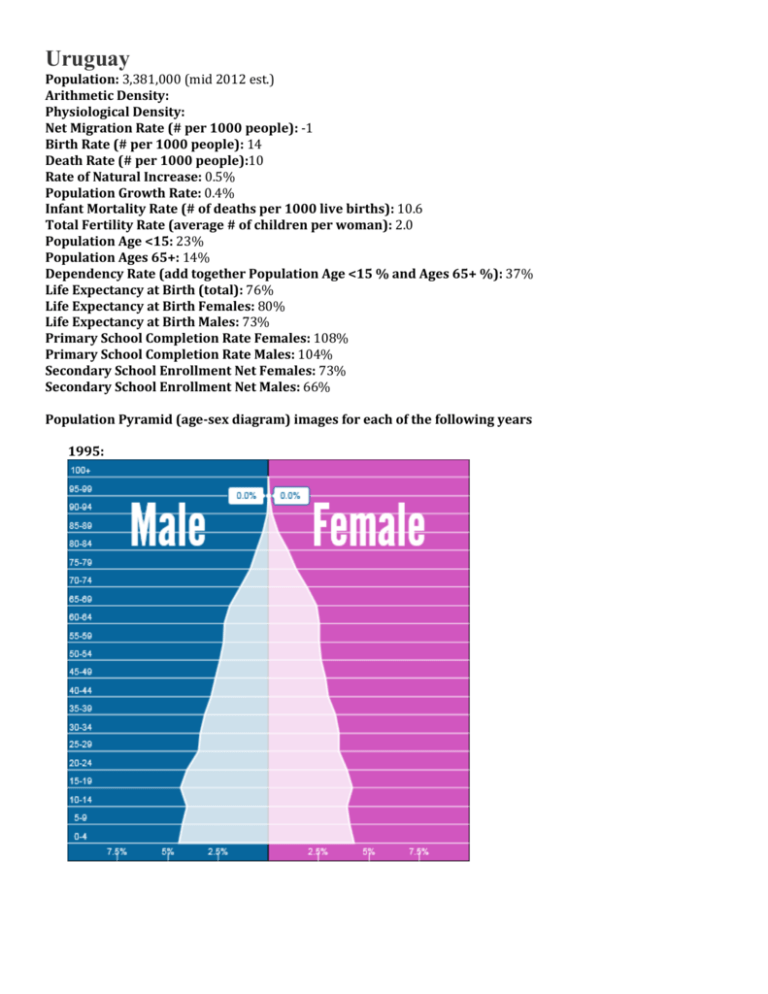
Uruguay Population: 3,381,000 (mid 2012 est.) Arithmetic Density: Physiological Density: Net Migration Rate (# per 1000 people): -1 Birth Rate (# per 1000 people): 14 Death Rate (# per 1000 people):10 Rate of Natural Increase: 0.5% Population Growth Rate: 0.4% Infant Mortality Rate (# of deaths per 1000 live births): 10.6 Total Fertility Rate (average # of children per woman): 2.0 Population Age <15: 23% Population Ages 65+: 14% Dependency Rate (add together Population Age <15 % and Ages 65+ %): 37% Life Expectancy at Birth (total): 76% Life Expectancy at Birth Females: 80% Life Expectancy at Birth Males: 73% Primary School Completion Rate Females: 108% Primary School Completion Rate Males: 104% Secondary School Enrollment Net Females: 73% Secondary School Enrollment Net Males: 66% Population Pyramid (age-sex diagram) images for each of the following years 1995: 2010: 2025: 2050: Demographic Transition Model (DTM): Insert the generic DTM image from Edmodo into each of your “Population” pages (right-click image, select “Save Picture As…”, and save) For each of your countries, compose a well-developed paragraph in which you identify the stage of the DTM the country is in and provide specific evidence from the above information to justify this identification.


