The Full Report
advertisement
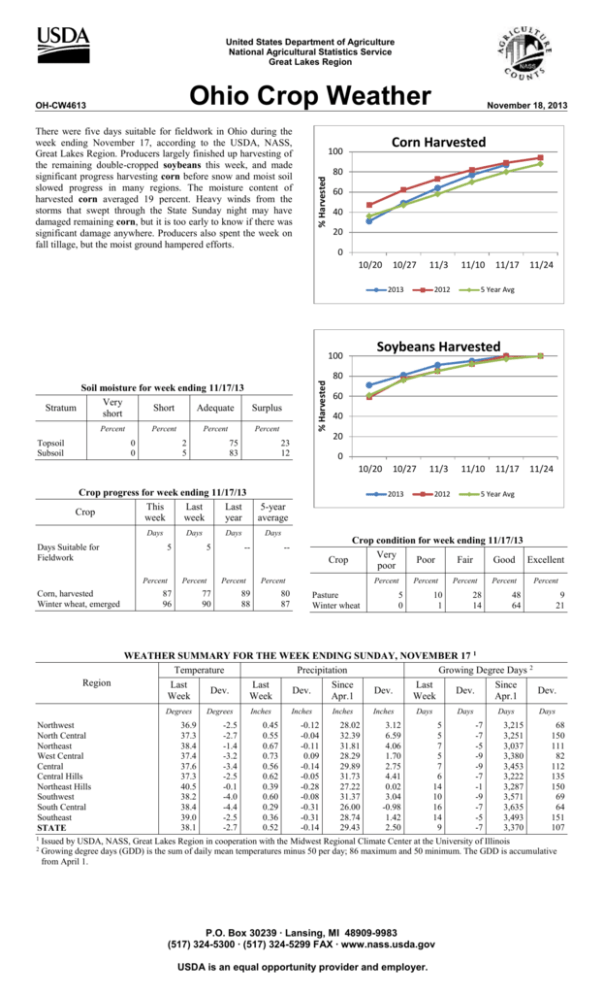
United States Department of Agriculture National Agricultural Statistics Service Great Lakes Region Ohio Crop Weather There were five days suitable for fieldwork in Ohio during the week ending November 17, according to the USDA, NASS, Great Lakes Region. Producers largely finished up harvesting of the remaining double-cropped soybeans this week, and made significant progress harvesting corn before snow and moist soil slowed progress in many regions. The moisture content of harvested corn averaged 19 percent. Heavy winds from the storms that swept through the State Sunday night may have damaged remaining corn, but it is too early to know if there was significant damage anywhere. Producers also spent the week on fall tillage, but the moist ground hampered efforts. 80 60 40 20 0 10/20 10/27 11/3 2013 % Harvested Percent Topsoil Subsoil Percent 0 0 Percent 2 5 Percent 75 83 23 12 Days Days Suitable for Fieldwork Days 5 Percent Corn, harvested Winter wheat, emerged Region Days 5 Percent 87 96 5 Year Avg 60 40 20 10/27 11/3 2013 11/10 2012 11/17 11/24 5 Year Avg 5-year average -- 77 90 11/24 0 Days Percent 2012 11/17 80 10/20 Crop progress for week ending 11/17/13 This Last Last Crop week week year 11/10 Soybeans Harvested 100 Soil moisture for week ending 11/17/13 Very Stratum Short Adequate Surplus short November 18, 2013 Corn Harvested 100 % Harvested OH-CW4613 Crop condition for week ending 11/17/13 Very Crop Poor Fair Good Excellent poor -- Percent 89 88 Percent 80 87 Pasture Winter wheat Percent 5 0 10 1 Percent 28 14 Percent Percent 48 64 9 21 WEATHER SUMMARY FOR THE WEEK ENDING SUNDAY, NOVEMBER 17 1 Temperature Precipitation Growing Degree Days 2 Last Last Since Last Since Dev. Dev. Dev. Dev. Dev. Week Week Apr.1 Week Apr.1 Degrees Degrees Inches Inches Inches Inches Days Days Days Days Northwest 36.9 -2.5 0.45 -0.12 28.02 3.12 5 -7 3,215 68 North Central 37.3 -2.7 0.55 -0.04 32.39 6.59 5 -7 3,251 150 Northeast 38.4 -1.4 0.67 -0.11 31.81 4.06 7 -5 3,037 111 West Central 37.4 -3.2 0.73 0.09 28.29 1.70 5 -9 3,380 82 Central 37.6 -3.4 0.56 -0.14 29.89 2.75 7 -9 3,453 112 Central Hills 37.3 -2.5 0.62 -0.05 31.73 4.41 6 -7 3,222 135 Northeast Hills 40.5 -0.1 0.39 -0.28 27.22 0.02 14 -1 3,287 150 Southwest 38.2 -4.0 0.60 -0.08 31.37 3.04 10 -9 3,571 69 South Central 38.4 -4.4 0.29 -0.31 26.00 -0.98 16 -7 3,635 64 Southeast 39.0 -2.5 0.36 -0.31 28.74 1.42 14 -5 3,493 151 38.1 -2.7 0.52 -0.14 29.43 2.50 9 -7 3,370 107 STATE 1 Issued by USDA, NASS, Great Lakes Region in cooperation with the Midwest Regional Climate Center at the University of Illinois 2 Growing degree days (GDD) is the sum of daily mean temperatures minus 50 per day; 86 maximum and 50 minimum. The GDD is accumulative from April 1. P.O. Box 30239 ∙ Lansing, MI 48909-9983 (517) 324-5300 ∙ (517) 324-5299 FAX ∙ www.nass.usda.gov USDA is an equal opportunity provider and employer.


