Inference for Proportions and Inference for a Population with answers
advertisement
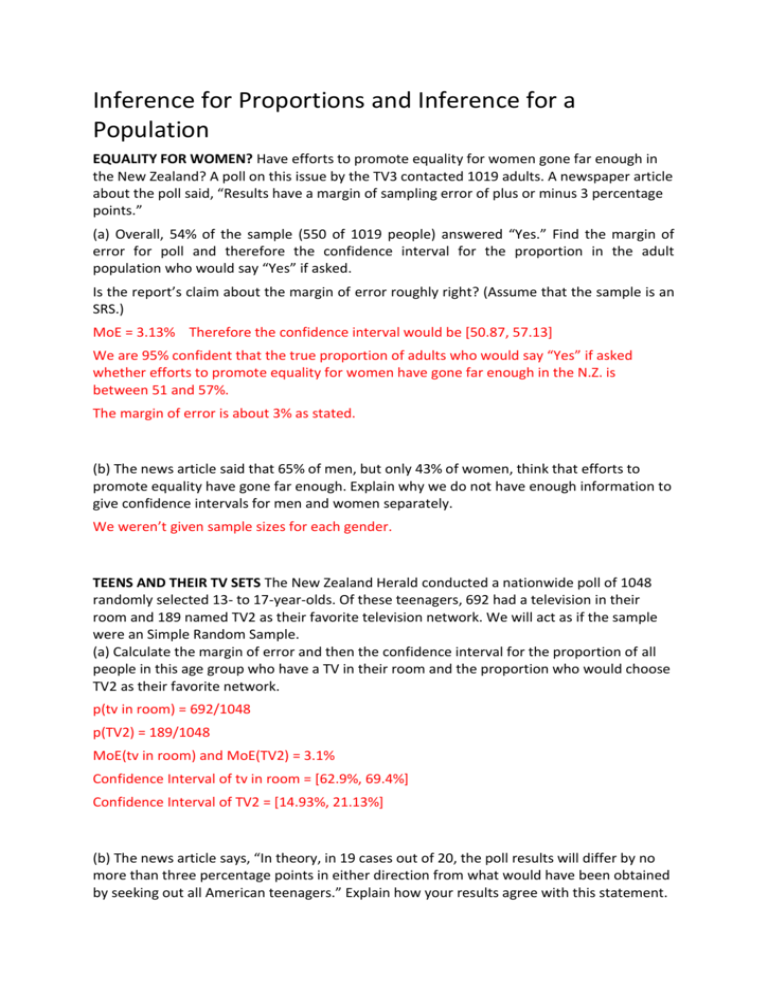
Inference for Proportions and Inference for a Population EQUALITY FOR WOMEN? Have efforts to promote equality for women gone far enough in the New Zealand? A poll on this issue by the TV3 contacted 1019 adults. A newspaper article about the poll said, “Results have a margin of sampling error of plus or minus 3 percentage points.” (a) Overall, 54% of the sample (550 of 1019 people) answered “Yes.” Find the margin of error for poll and therefore the confidence interval for the proportion in the adult population who would say “Yes” if asked. Is the report’s claim about the margin of error roughly right? (Assume that the sample is an SRS.) MoE = 3.13% Therefore the confidence interval would be [50.87, 57.13] We are 95% confident that the true proportion of adults who would say “Yes” if asked whether efforts to promote equality for women have gone far enough in the N.Z. is between 51 and 57%. The margin of error is about 3% as stated. (b) The news article said that 65% of men, but only 43% of women, think that efforts to promote equality have gone far enough. Explain why we do not have enough information to give confidence intervals for men and women separately. We weren’t given sample sizes for each gender. TEENS AND THEIR TV SETS The New Zealand Herald conducted a nationwide poll of 1048 randomly selected 13- to 17-year-olds. Of these teenagers, 692 had a television in their room and 189 named TV2 as their favorite television network. We will act as if the sample were an Simple Random Sample. (a) Calculate the margin of error and then the confidence interval for the proportion of all people in this age group who have a TV in their room and the proportion who would choose TV2 as their favorite network. p(tv in room) = 692/1048 p(TV2) = 189/1048 MoE(tv in room) and MoE(TV2) = 3.1% Confidence Interval of tv in room = [62.9%, 69.4%] Confidence Interval of TV2 = [14.93%, 21.13%] (b) The news article says, “In theory, in 19 cases out of 20, the poll results will differ by no more than three percentage points in either direction from what would have been obtained by seeking out all American teenagers.” Explain how your results agree with this statement. In both cases, the margin of error for a 95% CI (“19 cases out of 20”) was (no more than) 3%. (c) Is there good evidence that more than half of all teenagers have a TV in their room? The interval from (a) does not include 0.50 or less WE WANT TO BE RICH In a recent year, 73% of first-year college students responding to a national survey identified “being very well-off financially” as an important personal goal. Auckland Univerosty found that 215 of an Simple Random Sample of 400 of its first-year students say that this goal is important. (a) Calculate the confidence interval for the proportion of all first-year students at the university who would identify being well-off as an important goal. MoE = 5% Sample proportion = 53.75% Confidence Interval = [48.75%, 58.75%] We are 95% confident that the true proportion of all first-year students at this university who identify being well-off as an important goal is between 48.75% and 58.75%. (b) Is there good evidence that the proportion of all first-year students at this university who think being very well-off is important differs from the national value. Yes; the 95% confidence interval for this university contains only values that are less than 0.73, so it is likely that for this particular population, p differs from 0.73 (specifically, is less than 0.73). STARTING A NIGHT CLUB A university student organization wants to start a nightclub for students under the age of 21. To assess support for this proposal, they will select an Simple Random Sample of students and ask each respondent if he or she would patronize this type of establishment. They expect that about 70% of the student body would respond favorably. What sample size is required to obtain a confidence interval with an approximate margin of error of 0.04. Solving for n: 625 SCHOOL VOUCHERS A national opinion poll found that 54% of all New Zealand adults agree that parents should be given vouchers good for education at any public or private school of their choice. The result was based on a small sample. (a) How large an Simple Random Sample is required to obtain a margin of error of 0.03 (that is, ±3%) in an informal confidence interval? Solving for n: approximately 1100 (b) If the poll was conducted of 500 people, could the claim that more New Zealand adults agree that parents should be given vouchers? MoE = 4.47% Confidence Interval of proportion of NZ adults who agree = [49.53%, 58.47%] The Confidence Interval of the true population proportion of NZ adults who agree that parents should be given vouchers lies below 50%, the claim cannot be supported. There are other issues with the claim as the sample method was not described and there are no details of other categories such as undecided and what proportion disagreed. This information would allow me to create a confidence interval of the differences of the proportions within the sample and thus allow me to investigate the claim more fully. DRUNKEN CYCLISTS In the United States approximately 900 people die in bicycle accidents each year. One study examined the records of 1711 bicyclists aged 15 or older who were fatally injured in bicycle accidents between 1987 and 1991 and were tested for alcohol. Of these, 542 tested positive for alcohol (blood alcohol concentration of 0.01% or higher). (a) Find a 95% confidence interval for p. p = true proportion of all cyclists involved in fatal accidents who had alcohol in their systems SRS – we do NOT know that the examined records come from as SRS, so we proceed with caution. MoE = 2.41% Confidence interval for proportion of cyclists aged 15 or older fatally injured in a cyclist crash having tested positive for alcohol = [29.27%, 34.09%] If our assumptions had been satisfied we would be 95% confident that the true proportion of all cyclists involved in fatal accidents who had alcohol in their systems is between 29.27% and 34.09%. (b) Can you conclude from your statistical analysis of this study that alcohol causes fatal bicycle accidents? Explain. No: We do not know; for example, what percentage of cyclists who were not involved in fatal accidents had alcohol in their systems. IN-LINE SKATERS A study of injuries to in-line skaters used data from the National Electronic Injury Surveillance System, which collects data from a random sample of hospital emergency rooms. In the six-month study period, 206 people came to the sample hospitals with injuries from in- line skating. We can think of these people as an Simple Random Sample of all people injured while skating. Researchers were able to interview 161 of these people. Wrist injuries (mostly fractures) were the most common. (a) The interviews found that 53 people were wearing wrist guards and 6 of these had wrist injuries. Of the 108 who did not wear wrist guards, 45 had wrist injuries. What are the two sample proportions of wrist injuries? p(guard) = 11.32% p(no guard) = 41.67% (b) Give a 95% confidence interval for the difference between the two population proportions of wrist injuries. State carefully what populations your inference compares. We would like to draw conclusions about all in-line skaters, but we have data only for injured skaters. MoE(guard) = 13.73% MoE(no guard) = 9.62% Averaged MoE = 11.68% MoE x 1.5 (Two independent groups) = 23.36% Differences between the sample proportions = 11.32 - 41.67 = -30.35% Confidence Interval = [-53.71%, -6.99%] We are 95% confident that the true proportion of skaters with wrist injuries is lower by 53 to 7% for skaters who are wearing wrist guards. As the problem notes, this interval should at least apply to the two groups about whom we have information: skaters (with and without wrist guards) with severe enough injuries to go to the emergency room. (c) What was the percent of nonresponse among the original sample of 206 injured skaters? Explain why nonresponse may bias your conclusions. 45/206 = 0.218 did not respond. If those who did not respond were different in some way from those who did, then not having them represented in our sample makes our conclusions suspect. LYME DISEASE Lyme disease is spread in the northeastern United States by infected ticks. The ticks were infected mainly by feeding on mice, so more mice result in more infected ticks. The mouse population in turn rises and falls with the abundance of acorns, their favored food. Experimenters studied two similar forest areas in a year when the acorn crop failed. They added hundreds of thousands of acorns to one area to imitate an abundant acorn crop, while leaving the other area untouched. The next spring, 54 of the 72 mice trapped in the first area were in breeding condition, versus 10 of the 17 mice trapped in the second area. Give a 95% confidence interval for the difference between the proportion of mice ready to breed in good acorn years and bad acorn years. p(first area) = 75% p(second area) = 58.82 MoE(first area) = 11.78% MoE(second area) = 24.25% Averaged MoE = 18.02% MoE x 1.5 (Two independent groups) = 27.02% Differences between the sample proportions = 75 - 58.82 = 16.18% Confidence Interval = [-10.84%, 43.2%] We are 95% confident that the true proportion difference of breeding mice in the first area is lower by 11%, possibly equal and up to 43% higher than the true proportion of breeding mice in the second area. THE GOLD COAST A historian examining British colonial records for the Gold Coast in Africa suspects that the death rate was higher among African miners than among European miners. In the year 1936, there were 223 deaths among 33,809 African miners and 7 deaths among 1541 European miners on the Gold Coast. Consider this year as a sample from the pre-war era in Africa. Is there good evidence that the proportion of African miners who died was higher than the proportion of European miners who died? p(african) = 0.006595 p(euro) = 0.00454 MoE(african) = 0.005438 MoE(euro) = 0.02547 Averaged MoE = 0.01545 MoE x 1.5 (Two independent groups) = 0.023175 Differences between the sample proportions = 0.002055 Confidence Interval = [-2.11%, 2.5%] We are 95% confident that the true proportion difference of the death rate of African gold miners in 1936 is lower by 2%, possibly equal and up to 3.5% higher than the true proportion difference of the death rate of European miners in 1936. There is insufficient evidence to support the claim that the proportion of African miners who died was higher than the proportion of European miners who died.
