Section7.2-CI-Proportion
advertisement
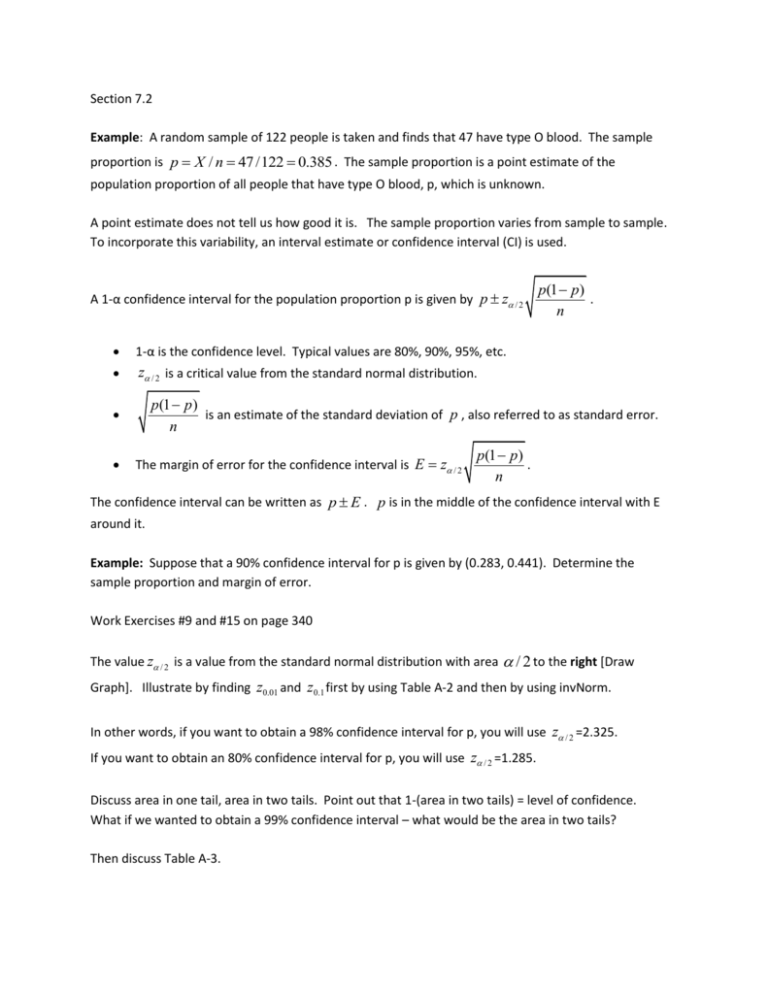
Section 7.2 Example: A random sample of 122 people is taken and finds that 47 have type O blood. The sample proportion is p X / n 47 /122 0.385 . The sample proportion is a point estimate of the population proportion of all people that have type O blood, p, which is unknown. A point estimate does not tell us how good it is. The sample proportion varies from sample to sample. To incorporate this variability, an interval estimate or confidence interval (CI) is used. A 1-α confidence interval for the population proportion p is given by p z / 2 1-α is the confidence level. Typical values are 80%, 90%, 95%, etc. z / 2 is a critical value from the standard normal distribution. p(1 p) is an estimate of the standard deviation of p , also referred to as standard error. n p(1 p) . n The margin of error for the confidence interval is E z / 2 p(1 p) . n The confidence interval can be written as p E . p is in the middle of the confidence interval with E around it. Example: Suppose that a 90% confidence interval for p is given by (0.283, 0.441). Determine the sample proportion and margin of error. Work Exercises #9 and #15 on page 340 The value z / 2 is a value from the standard normal distribution with area / 2 to the right [Draw Graph]. Illustrate by finding z0.01 and z0.1 first by using Table A-2 and then by using invNorm. In other words, if you want to obtain a 98% confidence interval for p, you will use z / 2 =2.325. If you want to obtain an 80% confidence interval for p, you will use z / 2 =1.285. Discuss area in one tail, area in two tails. Point out that 1-(area in two tails) = level of confidence. What if we wanted to obtain a 99% confidence interval – what would be the area in two tails? Then discuss Table A-3. Example: Work Exercise #33a, #34a, #35a beginning on page 341. Discuss using the calculator (STAT/TESTS/A) for each of the problems above. Sample size determination The American Red Cross wants to be 95% confident the sample proportion is within 5% of the true proportion of all people that have type O blood. In other words, they want the confidence interval to look like this: p 0.05 . We can accomplish this by determining the sample size. E z / 2 p(1 p) n 0.05 1.96 p(1 p) n 0.052 1.962 p(1 p) n 2 0.052 p(1 p) 1.962 n 2 1.96 n 2 0.05 p (1 p) 1.962 n p (1 p ) 0.052 We’ve run into a problem. Typically, we want to determine the sample size we need before ever collecting the data but remember that p X / n depends on n. Solution #1: Estimate p from a small study and use that estimate in the formula to determine the sample size needed. What if we obtained a sample of 122 people and found that 47 have type O blood. How many people need to be sampled to achieve the margin of error? Solution #2: Plot p versus p(1 p) . The largest that p(1 p) will ever be is when p =0.5 so use this in the formula instead. How many people need to be sampled to achieve the margin of error? continued … Sample size determination - work these exercises beginning on page 340: #26, #27, #28, #41, #44. Mixture of problems to work if time permits: page 382 #1, #2, #3, #7ab,


