File - Portfolio of Justin Nanagas
advertisement
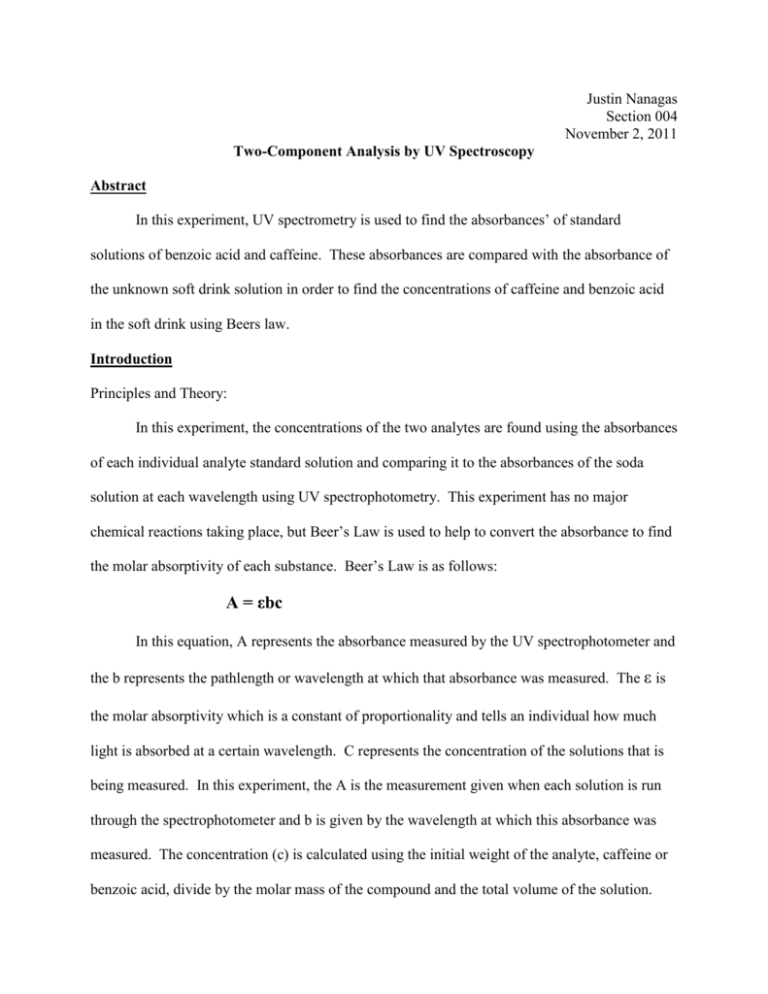
Justin Nanagas Section 004 November 2, 2011 Two-Component Analysis by UV Spectroscopy Abstract In this experiment, UV spectrometry is used to find the absorbances’ of standard solutions of benzoic acid and caffeine. These absorbances are compared with the absorbance of the unknown soft drink solution in order to find the concentrations of caffeine and benzoic acid in the soft drink using Beers law. Introduction Principles and Theory: In this experiment, the concentrations of the two analytes are found using the absorbances of each individual analyte standard solution and comparing it to the absorbances of the soda solution at each wavelength using UV spectrophotometry. This experiment has no major chemical reactions taking place, but Beer’s Law is used to help to convert the absorbance to find the molar absorptivity of each substance. Beer’s Law is as follows: A = εbc In this equation, A represents the absorbance measured by the UV spectrophotometer and the b represents the pathlength or wavelength at which that absorbance was measured. The ε is the molar absorptivity which is a constant of proportionality and tells an individual how much light is absorbed at a certain wavelength. C represents the concentration of the solutions that is being measured. In this experiment, the A is the measurement given when each solution is run through the spectrophotometer and b is given by the wavelength at which this absorbance was measured. The concentration (c) is calculated using the initial weight of the analyte, caffeine or benzoic acid, divide by the molar mass of the compound and the total volume of the solution. Once all of these measurements are gathered, Beer’s law can algebraically manipulated in order to calculate the molar absorptivity which will be used to calculate the amount of each compound is in the soda solution. Instrumental: For this experiment, a UV spectrophotometer is used to measure the absorbance of each of the standard solution along with the unknown solution. The setup of the spectrophotometer is as follows: Procedure Part I Benzoic acid solid was obtained and approximately 0.0125 g was weighed out and placed into a 100 mL beaker. The actual weight was recorded in Table 1. 50 mL of deionized water was then added to the beaker, and the solution was mixed until solid dissolved. Once solid was dissolved, the solution was transferred to a 1 L volumetric flask. The 100 mL beaker was washed twice with 50 mL portions of deionized water and then added to the 1 L volumetric flask. The solution was then diluted to the mark with deionized water to finish the benzoic acid standard. Part II A caffeine solid was obtained and approximately 0.0250 g of the solid was weighed out and placed into a 100 mL beaker. The actual weight of the solid was recorded into Table 1 below. 50 mL of deionized water was then added to the beaker and the solid was dissolved. This solution was then transferred to a 1 L volumetric flask and the 100 mL beaker was washed twice with 50 mL beaker just as it was done in Part I. 1.00 mL of concentrated HCl was then added to the flask which was then diluted to the line with deionized water. Part III About 20 mL soft drink unknown was obtained and poured back and forth between two 100 mL beakers until it was decarbonated. 10.00 mL of this soda was then pipetted into a 250 mL volumetric flask along with 50 mLof deionized water. 0.20 mL, or two drops, of concentrated HCl was added to the flask, and then the dilution was finished with deionized water. Part IV The “UV Probe 2.33” program on the computer was opened. Once logged the “Connect” button was pressed followed by the “Spectrum” button on the top menu. “M” was selected at that point to get to the meth screen. The parameters were entered as follows: Wavelength Range: 350-200 nm Speed: Fast Sampling Interval: Auto Single Scan Mode A blank cuvette was then inserted into the back position of the sample chamber. The then the sample of benzoic acid in the other cuvette was placed in the front position. The chamber was closed then “Auto zero” and the “start” button was clicked. Once the spectrum was collected, “Point Pick” was selected and the wavelengths of 230 nm and 273 nm were enter. The absorbance values were then given at those wavelengths and were recorded into the tables below. The blank was left in the back position, while the front cuvette is washed out with the next solution being tested then filled and the steps for obtaining the spectrum was repeated. This was done for the caffeine standard solution as well as the soft drink solution. These absorbances were also recorded into the tables below. Results Table 1 variable Initial Calculated Absorbance Absorbance weight (g) Concentration (230 nm) (273nm) (M) Benzoic Acid (X) X 0.0142 g 1.15x10⁻⁴ M 1.239 0.110 Caffeine (Y) Y 0.0256 g 1.32x10⁻⁴ M 0.711 1.340 230 nm λ' 273 nm λ'' Table 2 variable Absorbance A' 1.450 A'' 0.463 Molar Absorptivity of X at λ' εX' 4.64*108 M-1cm-1 Molar Absorptivity of X at λ'' εX'' 3.47*107 M-1cm-1 Molar Absorptivity of Y at λ' εY' 2.34*108 M-1cm-1 Molar Absorptivity of Y at λ'' εY'' 3.78*108 M-1cm-1 Absorbance of 2-component mixture at λ' Absorbance of 2-component mixture at λ'' Calculations: Concentrations: (Benzoic acid) [(0.0142 g of X)*(1mol / 122.12g)] / 1 L = 1.16*10-4 M (Caffeine) [(0.0256 g of Y)*(1mol / 194.19g)] / 1 L = 1.32*10-4 M Molar Absorptivity: (X) at 230 nm 230 nm = 2.30*10-5 cm A = εbc εX’ = A / bc = 1.239/ [(2.30*10-5cm)(1.16*10-4M)] = 4.64*108 M-1cm-1 (X) at 273 nm 273 nm = 2.73 * 10-5 εX’’ = A / bc = 0.110 / [(2.73*10-5cm)(1.16*10-4M)] = 3.47*107 M-1cm-1 (Y) at 230 nm εY’ = A / bc = 0.711 / [(2.30*10-5cm)(1.32*10-4M)] = 2.34*108 M-1cm-1 (Y) at 273 nm εY’’ = A / bc = 1.340 / [(2.73*10-5cm)(1.32*10-4M)] = 3.78*108 M-1cm-1 Concentrations in Soft drink: [X] =[[(A’)( εY’’b)] - [(A’’)( εY’b)]] / [[(εX’b)( εY’’b)] – [(εY’b)( εx’’b)]] = [[(1.45)(3.78*108 M-1cm-1)*(2.73*10-5cm)] – [(0.463)(2.34*108 M-1cm-1)(2.30*10-5)]] [[(4.64*108 M-1cm-1)(2.30*10-5cm)(3.78*108 M-1cm-1)(2.73*10-5cm)] – [(2.34*108 M-1cm-1)(2.30*10-5cm)(3.47*107 M-1cm-1)(2.73*10-5 cm)]] = [(1.496*104) – (2.492*103)] [(1.101*108) – (5.098*106)] = 1.19*10-4 M [Y] = [[(A’’)( εX’b)] - [(A’)( εX’’b)]] / [[(εX’b)( εY’’b)] – [(εY’b)( εx’’b)]] = [[(0.463)(4.64*108 M-1cm-1)(2.30*10-5 cm)] – [(1.45)(3.47*107 M-1cm-1)(2.73*10-5 cm)]] [[(4.64*108 M-1cm-1)(2.30*10-5cm)(3.78*108 M-1cm-1)(2.73*10-5cm)] – [(2.34*108 M-1cm-1)(2.30*10-5cm)(3.47*107 M-1cm-1)(2.73*10-5 cm)]] = [(4.941*103) – (1.374*103)] [(1.101*108) – (5.098*106)] = 3.40*10-5 M Amount of Analyte in 12 oz (355 mL) soft drink: (Benzoic acid) (1.19*10-4 M) (.355L)(122.12 g/mol) = 5.16*10-4g = 51.6 mg of benzoic acid in 12oz soda (3.40*10-5M)(.355L)(194.19 g/mol) = 2.34*10-4g = 23.4 mg of caffeine in 12oz soda Discussion For this experiment, the soda unknown was found to contain 51.6 mg of benzoic acid and 23.4 mg of caffeine. These amounts were calculated using the absorbance from the UV spectroscopy, the concentrations of each standard solution, and the wavelengths at which each absorbance measurement was taken. The absorbance data was used to find the molar absorptivity of each substance at each wavelength using Beer’s Law which was described in the introduction. Once all these measurements were calculated, the concentrations of each were able to be found. Some of the error that involved in this experiment could have been a result of the systematic error caused by some of the solids used in the standards may not have completely dissolved into solution when transferred and was lost. Or some of the solution may not have been adequately washed out of the beakers and transferred into the volumetric flasks. This may have given concentration of the standard solutions than that which was calculated which would in turn skew every calculated value that needed those concentrations. Another source of systematic error could have resulted from smudges or blemishes on the cuvettes that were used. The UV spectrophotometer is a very sensitive instrument and any smudges may have caused it to sense a higher level of absorption than would have been found if a smudge had not been on the cuvette. The best way to improve this experiment would be to have a test that would help to confirm the concentrations of the standard solutions so that the absorption measurements of the standards are not skewed as a result of inaccurate measurements.
