Supporting Information
advertisement
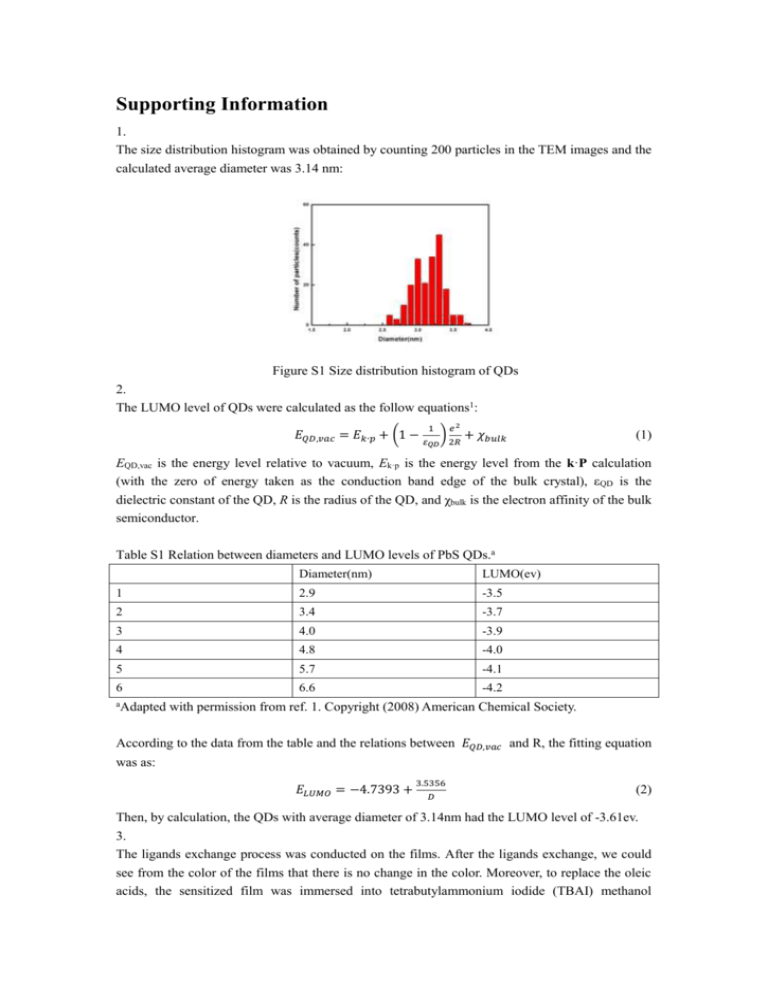
Supporting Information 1. The size distribution histogram was obtained by counting 200 particles in the TEM images and the calculated average diameter was 3.14 nm: Figure S1 Size distribution histogram of QDs 2. The LUMO level of QDs were calculated as the follow equations1: 𝐸𝑄𝐷,𝑣𝑎𝑐 = 𝐸𝑘∙𝑝 + (1 − 1 ) 𝑒2 𝜀𝑄𝐷 2𝑅 + 𝜒𝑏𝑢𝑙𝑘 (1) EQD,vac is the energy level relative to vacuum, Ek·p is the energy level from the k·P calculation (with the zero of energy taken as the conduction band edge of the bulk crystal), εQD is the dielectric constant of the QD, R is the radius of the QD, and χbulk is the electron affinity of the bulk semiconductor. Table S1 Relation between diameters and LUMO levels of PbS QDs.a Diameter(nm) LUMO(ev) 1 2.9 -3.5 2 3.4 -3.7 3 4.0 -3.9 4 4.8 -4.0 5 5.7 -4.1 6 6.6 -4.2 aAdapted with permission from ref. 1. Copyright (2008) American Chemical Society. According to the data from the table and the relations between 𝐸𝑄𝐷,𝑣𝑎𝑐 and R, the fitting equation was as: 𝐸𝐿𝑈𝑀𝑂 = −4.7393 + 3.5356 𝐷 (2) Then, by calculation, the QDs with average diameter of 3.14nm had the LUMO level of -3.61ev. 3. The ligands exchange process was conducted on the films. After the ligands exchange, we could see from the color of the films that there is no change in the color. Moreover, to replace the oleic acids, the sensitized film was immersed into tetrabutylammonium iodide (TBAI) methanol solution for 2 hours. After that, the solution remained colorless and clear. Therefore, we could conclude that QDs population was not lost during the ligands exchange. Figure S2 Photographs of films. From left to right: (a) unsensitized bare TiO2 film, (b) sensitized film before ligands exchange, (c) sensitized film after ligands exchange. The SEM images of the films before and after ligands exchange was also obtained and the scale bar is 100nm. There was no obvious difference and that might originate from that QDs were too small for this scale bar. Figure S3 SEM images of the films (a) before and (b) after ligands exchange. 4. By employing the model and equation William W. Yu suggested2, we could get the atomic component and percentage for our 3.14nm QDs. The number of sulfur atom could be calculated from the follow equation: 4 n𝑆 = 3 𝐷 2 𝜋( −𝑑𝑠ℎ𝑒𝑙𝑙 )3 𝜌𝑃𝑏𝑆 𝑁𝐴 𝑀𝑃𝑏𝑆 (3) D=3.1nm; dshell=0.294nm; 𝜌𝑃𝑏𝑆 =7.5g/cm3,MPbS=239.26g/mol Using the Pb:S ratio of 1.5:1, then the 3.14nm PbS QDs consist of Pb246S164I82. So the atomic percentage of Pb, S, I was 50%, 33.3%, and 16.7%. The result was consistent with the XPS results. So our QDs was consistent with the model William W. Yu suggested in which QDs was composed of a PbSe core and a Pb-terminated surface shell. References: (1) Hyun, B.-R.; Zhong, Y.-W.; Bartnik, A. C.; Sun, L.; Abruna, H. D.; Wise, F. W.; Goodreau, J. D.; Matthews, J. R.; Leslie, T. M.; Borrelli, N. F. ACS Nano, 2008, 2, 2206. (2) Dai, Q.; Wang, Y.; Li, X.; Zhang, Y.; Pellegrino, D. J.; Zhao, M.; Zou, B.; Seo, J. T.; Yu, W. W. ACS nano, 2009, 3, 1518.
