TUPE Report - Oakland Unified School District
advertisement
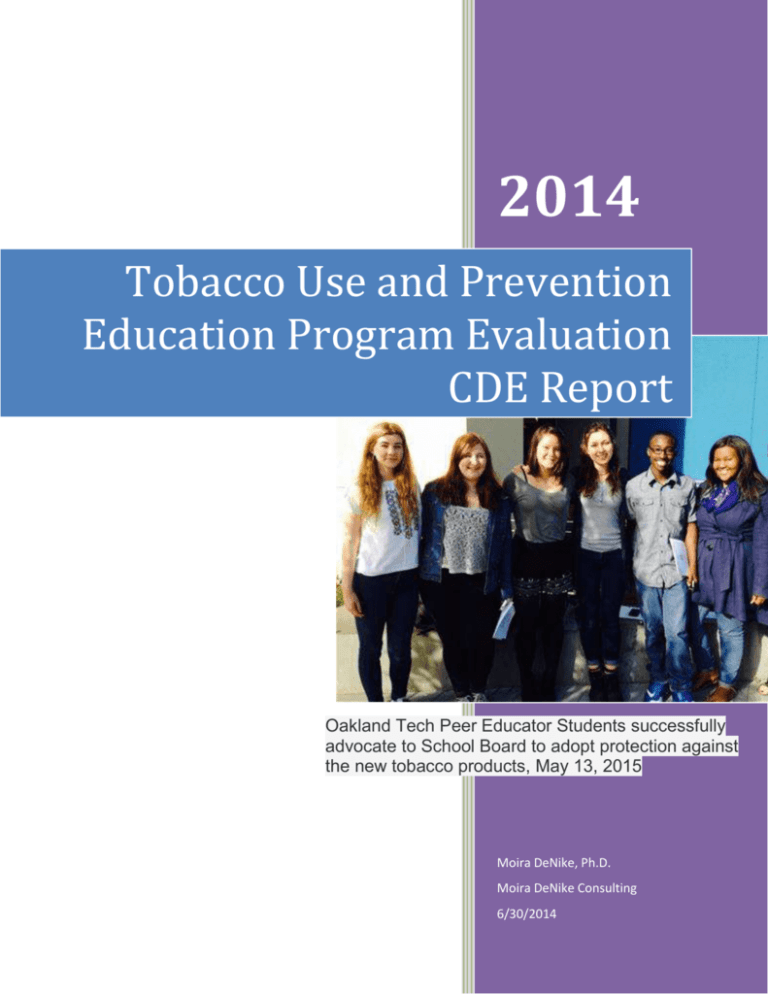
2014 Tobacco Use and Prevention Education Program Evaluation CDE Report Oakland Tech Peer Educator Students successfully advocate to School Board to adopt protection against the new tobacco products, May 13, 2015 Moira DeNike, Ph.D. Moira DeNike Consulting 6/30/2014 Table of Contents Executive Summary............................................................................................................................1 Outcomes .................................................................................................................................................. 1 Analysis ..................................................................................................................................................... 2 Program Overview .............................................................................................................................3 Logic Model ............................................................................................................................................... 3 Evaluation Methods .................................................................................................................................. 4 Outputs .............................................................................................................................................5 Participant Characteristics ........................................................................................................................ 5 Outcomes ..........................................................................................................................................6 Classroom Presentations .......................................................................................................................... 6 TUPE Intervention Coach Sessions............................................................................................................ 7 Peer Educators ........................................................................................................................................ 11 School Partnerships ................................................................................................................................ 13 Discussion ....................................................................................................................................... 16 Conclusion & Recommendations ...................................................................................................... 16 References....................................................................................................................................... 17 OUSD TUPE Report 2014-15 © 2015 Moira DeNike Consulting 0 Executive Summary Oakland Unified School District has completed its 14th year operating Tobacco Use and Prevention Education (TUPE). This year’s evaluation was compiled by Moira DeNike, Ph.D. and draws from multiple data sources, including: Post TUPE Presentation Survey, TUPE program logs, Post-Intervention Student Survey, Pre-Post Peer Educator Survey, and TUPE Partner Feedback Survey. Outcomes Positive outcomes were found for intervention services, prevention strategies, Peer Educator program participation, and school partnership. Intervention The primary outcome area that the evaluation considers is the impact on students who received one-onone or group intervention. Below are highlights from the findings in this area: 572 referrals to services were made, resulting in 500 unduplicated individuals receiving one-onone or group support from a TUPE intervention coach 1455 individual and 69 group sessions took place, for a total of 1763 interventions In TUPE program logs, 607 quit attempts were recorded, representing 61% of participants In Post-Intervention Student Surveys, 24% indicated they had quit, and 65% indicated they were in the process of quitting or had quit altogether In Post-Intervention Student Surveys, 85.8% indicated reductions in use by half or more In TUPE program logs, 1099 efforts to cut back were recorded, representing 85% of participants Also in the Post-Intervention Students Surveys o 97% report feeling more optimistic about the future because of the TUPE program o 95% believe they are healthier because of TUPE o 97% indicate that they are doing better in school because of TUPE o 96% report that they are getting in trouble at school less because of TUPE o 96% say they are attending school more because of TUPE support Follow-up administrations of the survey showed increased reductions in use, resiliency factors, and school engagement suggesting that ongoing support resulted in deeper impact Classroom Presentations Students who had seen classroom presentations were asked to complete a questionnaire afterwards. From these questionnaires and from TUPE logs, the following findings were recorded: 791 classroom and school-wide presentations were made – 156 by peer educators,273 by TUPE intervention coaches, and 362 by teachers 16,648 students saw the presentations (potentially duplicated count) – 6,959 saw peer educator presentations, 3,996 saw TUPE intervention coach presentations, and 5,693 saw teacher presentations OUSD TUPE Report 2014-15 © 2015 Moira DeNike Consulting 1 Over 80% of students who saw a peer educator presentation reported that they gained awareness of the negative effects of tobacco, marijuana, alcohol, and other drugs 66% of students seeing the presentation (if the question was applicable) indicated that they were more likely to quit or reduce their use because of the presentation 46% of students who saw the presentation planned to tell friends about it Peer Educators Peer educators were given a pre-post survey Analysis of Variance (ANOVA) testing showed statistically significant improvement among peer educators in confidence, sense of agency/empowerment, and knowledge/skills. 95% of respondents (61) indicated that they were “proud” of the work they had done as a peer educator Many peer educators expressed that the experience had helped them gain skills, and that they valued the opportunity to help their peers and community School Partnerships A questionnaire was distributed to leaders at all TUPE partner schools. The following findings reflect the 23 responses that were submitted from 14 school sites: 83% of school leaders surveyed felt the one-on-one coaching was the most effective TUPE service provided 79% felt the TUPE intervention coach was highly regarded by students 70% felt the TUPE intervention coach was a good partner in building positive school climate 70% felt the TUPE intervention coach responded appropriately to suggestions or concerns 60% felt students served by TUPE intervention services were doing better in school Analysis Overall the program was effective in meeting its stated objectives for intervention as well as prevention Post-intervention responses showed that outcomes were generally more profound in follow-up survey administration as compared with first-time survey administration (including reduction in use, and increased resiliency), indicating that for most outcome areas students saw improved growth as supports continued By contrast, follow-up surveys did not show improved rates of self-reported cessation behavior, suggesting that while reduction increased over time, relapse continued to be an issue for students Comments from school leaders suggest that TUPE intervention coaches are spread a bit thin and that increased time at the school site would be highly valued and might produce greater levels of school leader satisfaction and impact OUSD TUPE Report 2014-15 © 2015 Moira DeNike Consulting 2 Program Overview Oakland Unified School District (OUSD) has recently completed its 14th year of implementing Tobacco Use and Prevention Education (TUPE), made possible by a grant from the California Department of Education. The 2014-15 school year was the second in the current 3-year grant cycle. The program goals are to empower youth with comprehensive alcohol, tobacco, and drug prevention and intervention education in order to guide them towards: reduction and cessation of use, healthier choices, and deeper school engagement. The program uses strengths-based practices to develop life skills and help students cultivate intrinsic, positive motivations. For prevention, the TUPE prevention approach centers around classroom and school-wide presentations, often made by trained peer educators. For intervention TUPE intervention coaches provide one-on-one and group sessions for students who want to reduce or quit. The expected outcomes of the program fall into three programmatic impact areas: 1) the impact on students who see the classroom or school-wide presentations, 2) the impact on students who participate in intervention groups or one-on-one counseling, 3) the impact on the peer educators, and 4) the satisfaction of schools with the TUPE partnership. OUSD’s TUPE program is staffed by 6 counselors (4 FTE ) and one program administrator who together operate the program at 27 schools. Most participating school have a TUPE counselor onsite one day a week for approximately 5 hours, 10 schools have a TUPE counselor onsite 2 days a week. Logic Model Strategy Outputs Outcomes Measure/Tool Classroom presentations to students # of presentations # of students receiving presentation Increased awareness of negative effects Increased interest in quitting or cutting back Intention to inform friends of negative effects One-on-one and group sessions with TUPE intervention coach # of individuals participating in group or individual sessions # of individual sessions # of group sessions Reduction in use Efforts toward quitting Increased resiliency Increased school engagement/connectedness Post-Intervention Student Survey Peer Educator training and engagement # of individuals engaged as Peer Educators # of presentations # of students reached through presentations Increased confidence, sense of agency, empowerment, and knowledge/skills Pre-Post Peer Educator Survey School partnership # of schools receiving TUPE support # of COST meetings in which TUPE Intervention Coaches participated General satisfaction with partnership Feedback to help improve TUPE-school partnerships TUPE Partner Feedback Survey Post TUPE Classroom Presentation Survey OUSD TUPE Report 2014-15 © 2015 Moira DeNike Consulting 3 Evaluation Methods The following methods were used to compile this report: Post TUPE Presentation Survey: After each peer educator classroom presentation, students were asked to complete a questionnaire that asked them about the impact of the presentation on their understanding of the effects of tobacco and other substances, about their interest in sharing what they had learned with their peers, and their overall impression of the quality of the presentation. The survey included both closed-ended and open-ended questions. Approximately 1,900 of these surveys were received. A systematic random sample of 380 (20%) was drawn and analyzed for this report. TUPE Program Logs: TUPE Intervention Coaches and Peer Educators were asked to log all of their activities, including: classroom and large group presentations, group and individual student interventions, Coordination of Services Team (COST) meetings, etc. These service logs were analyzed to determine most of the program outputs listed in the logic model, as well as quit attempts and efforts at reduction. Post-Intervention Student Survey: All students who received one-on-one or group counseling or coaching from a TUPE Intervention Coach were asked to complete a questionnaire that asked them about the impact of the supports on their patterns of use (including whether they had attempted to quit), as well as general youth development, resiliency, and school engagement/connected measures. The questionnaire was primarily open-ended with some closed-ended questions. TUPE Intervention Coaches administered the survey toward the end of the Fall semester (first survey administration) and again during Spring (follow-up survey administration). There were 312 surveys that were returned – 116 captured follow-up data. Pre-Post Peer Educator Survey: Peer educators from 11 schools were trained and mentored throughout the school year. At the beginning of their involvement in the program they were asked to complete a questionnaire designed to measure their confidence, subject-matter expertise, presentation skills, and school engagement levels. At the end of the academic school year, after they had made multiple presentations to peers as well as adults, the questionnaire was re-administered to gauge whether they had grown in any of these areas. Pre-post data were collected from 64 of the 212 Peer Educators engaged in 2014-15. TUPE Partner Feedback Survey: At each school that was involved with TUPE, the school administrator who was most closely involved with TUPE service delivery was asked to complete a questionnaire which asked them about the quality of the partnership, what they perceived as the most effective TUPE strategies, and what improvements could be made to enhance TUPE’s effectiveness. From 27 participating schools, 15 TUPE Partner Feedback Surveys were received. OUSD TUPE Report 2014-15 © 2015 Moira DeNike Consulting 4 Outputs Outputs for each of the four programmatic impact areas are listed below. # of classroom and school-wide presentations made 791* # of students receiving presentation 16,648** # of individuals participating in group or individual sessions 500 # of individual sessions 1455 Groups and One-on# of group sessions 69 One with TUPE # of total interventions 1763 Intervention Coaches # of quit attempts 607 # of reductions in use reported 1099 # of individuals engaged as Peer Educators 212 # of Peer Educator presentations made (classroom + school-wide) 156 Peer Educators # of students reached through Peer Educator presentations 6,959 (classroom + school-wide) # of schools receiving TUPE support 27 School Partnership # of COST meetings in which TUPE Intervention Coaches 351 participated *156 by peer educators,273 by TUPE intervention coaches, and 362 by teachers **6,959 saw peer educator presentations, 3,996 saw TUPE intervention coach presentations, and 5,693 saw teacher presentations Classroom Presentations Participant Characteristics The majority of students served by the program (sourced from the Post-Intervention Survey) were in high school. There were more male students than female served, and a substantial majority of students served were African American. The demographics of the students served by the program are provided in the tables below: Grade 6th 7th 8th 9th 10th 11th 12th Total Frequency 7 14 36 23 79 73 77 309 Percent 2.3% 4.5% 11.7% 7.4% 25.6% 23.6% 24.9% 100.0% Average # of Sessions Range 1-20 Middle/High 18.5% 81.5% 100% 4.97 Gender Male Female Transgender Ethnicity African American Latino White Indigenous Asian Arab/South Asian Other % 71% 29% .3% # 244 66 5 3 4 1 1 % 78% 21% 2% 1% 1% 0% 0% OUSD TUPE Report 2014-15 © 2015 Moira DeNike Consulting 5 About two-thirds of the students served first engaged with TUPE because they were caught in possession of or using tobacco or other substances. Referral Reason Frequency Percent To avoid suspension (got caught!) 205 66.6% It was suggested by an adult on campus 81 26.3% I referred myself 20 6.5% My parent or guardian asked me to 2 .6% Total 308 100.0 Outcomes Classroom Presentations Based on a representative sample of post-presentation questionnaire, classroom presentations appear to have had the desired impact of increasing awareness of negative effects, increasing interest in quitting or cutting back, and creating the intention to inform friends of negative effects. Increased awareness of negative effects A majority of students who saw the presentations reported that they had gained awareness and learned something new. Survey Question The presentation made me more aware of the negative effects of tobacco, marijuana, alcohol and other drugs I learned something new about tobacco and marijuana # 305 % 80.5% 256 68.3% Increased Interest in Quitting or Cutting Back A majority of students (who felt the question was applicable) indicated that they were more likely to cut back because of what they learned in the peer educator presentation. Survey Question: If you do use tobacco, weed, alcohol, ecstasy, etc., will you be more likely to cut back or quit because of the presentation Yes No/Not Sure *for 110 students this question was not applicable. # % 177 92 66%* 34%* OUSD TUPE Report 2014-15 © 2015 Moira DeNike Consulting 6 Intention to Inform Friends of Negative Effects A significant proportion (46%) of the students who saw the presentation expected to share what they learned with their friends. Several others were unsure (44%), and a small minority did not plan to talk with their friends about it. I plan on sharing the information I learned with my friends? 10% yes 46% not sure no 44% TUPE Intervention Coach Sessions Reductions in Use An analysis of all surveys shows that a large majority of responses indicated students reducing their use by half or more (85.8%). No significant gender or ethnic differences were found on this variable. Reduction in Use (irrespective of T/W) Frequency Percent No reduction in use Reduced "a little" Reduced by half Reduced by more than half Quit completely Total 5 37 77 105 71 295 1.7% 12.5% 26.1% 35.6% 24.1% 100.0% A significant difference was found between the first post-intervention survey administration and followup survey administration, with a greater likelihood of reduced use measured in follow-up survey administration (p<.001). This demonstrates that efforts to cut back may have been more effective as students continued working with their TUPE intervention coaches. Reduction in Use First administration Minor/no reduction Half or more reduction Total 18.5% (32) 81.5% (141) 100% (173) Follow-up administration 7.8% (9) 92.2% (107) 100% (116) Total 14.2% (41) 85.8% (248) 100% (289) OUSD TUPE Report 2014-15 © 2015 Moira DeNike Consulting 7 During every coaching session, TUPE intervention coaches attempted to ask participants whether they had cut back since their last meeting. These responses were logged, and a total of 1099 efforts to cut back were recorded among the 500 participants, with 85% of participants (357) reporting at least once that they had reduced their use, and 15% (62) reporting that they had not reduced their use at all (note: this data point was not recorded for 81 of the participants, who either refused to answer or were not asked the question – these cases are not included in the analysis). Efforts toward Quitting At each coaching session, intervention coaches also attempted to ask participants whether they had made a quit attempt since their last meeting. These responses were logged, and a total of 607 quit attempts were recorded among the 500 participants, with 61% of participants (247) reporting at least one quit attempt, and 39% (158) reporting no quit attempts (note: this data point was not recorded for 95 of the participants, who either refused to answer or were not asked the question – these cases are not included in the analysis). Questions about attempting to quit were included in the post-intervention survey, as well. Responses from a total of 292 surveys revealed a similar pattern as the service logs, with just over 65% of respondents indicating that they were either in the process of quitting or had quit altogether, and just under 35% indicating that they had not quit or were still in the ideation phase. Efforts in Quitting (irrespective of T/W) Frequency Percent Not thinking about quitting Thinking about quitting In the process of quitting Quit and trying not to use anymore Total 12 89 121 70 292 4.1% 30.5% 41.4% 24.0% 100% A small majority of respondents (65.9%) indicated they were in the process of quitting. No significant gender or ethnic differences were found on this variable. In the follow-up survey administration respondents were less likely to indicate that they were in the process of quitting, as compared with the first survey administration, suggesting that some portion of students receiving ongoing support experienced relapse. Efforts in Quitting First administration of post-intervention survey Follow-up administration of postintervention survey Total Not in the process of quitting In process of quitting Total 27.3% (47) 72.7% (125) 100% (172) 44.4% (51) 55.6% (64) 100% (115) 34.1% (98) 65.9% (189) 100% (287) OUSD TUPE Report 2014-15 © 2015 Moira DeNike Consulting 8 Increased Resiliency Students were asked a number of questions on the Post-Intervention Student Survey which pertained to resiliency factors such as attitude, social associations and activities, and overall health. Survey results show that on average students felt that participation in TUPE supports had a positive impact on all of these resiliency factors. "Because of the TUPE program..." I feel more optimistic about the future I am healthier Very true Somewhat true I'm doing something constructive after school Not true I have made different friends I'm more interested in volunteering to help in my community 0% 50% 100% Students were more likely to report increased resiliency during follow-up administration of the survey, as compared with the first administration, suggesting that as supports continued, so did their perception that TUPE was helping move them toward positive attitudes and behaviors. Greater Improvement in Resiliency Over Time 100% 90% 80% 70% 60% 50% 40% 30% 20% 10% First time Follow-up I'm more I have made interested in different friends volunteering to help in my community I'm doing something constructive after school I am healthier I feel more optimistic about the future OUSD TUPE Report 2014-15 © 2015 Moira DeNike Consulting 9 Increased School Engagement/Connectedness Students were asked a number of questions on the Post-Intervention Student Survey which pertained to school engagement factors such as attendance, connectedness, and behavior at school. Survey results show that on average students felt that participation in TUPE supports helped them to be more engaged in all the ways asked. Increased School Engagement I get in trouble at school less I'm attending school more regularly Very true I'm doing better in school Somewhat true Not true I feel more connnected to the school I have more adults at this school that I trust 0% 20% 40% 60% 80% 100% Students were also more likely to demonstrate increased school engagement and connectedness during follow-up administration of the survey, as compared with the first administration. Greater Improvement in School Engagement Over Time 100% 90% 80% 70% 60% 50% First time 40% Follow-up 30% 20% 10% I have more adults at this school that I trust I feel more I'm doing better connnected to in school the school I'm attending I get in trouble at school more school less regularly OUSD TUPE Report 2014-15 © 2015 Moira DeNike Consulting 10 Effectiveness of Program Strategies When asked to indicate what about the TUPE program was most helpful to them, students who received intervention supports were most likely to point to “being listened to,” their relationship with their coaches, and goal-setting. Developing skills for managing their emotions and managing stress also stood out as important for a small majority of respondents. Intervention Strategy Being listened to My relationship with by TUPE intervention coach Setting goals with my coach Learning skills to help me deal with my emotions Learning skills for managing stress Coaching by coach to help me achieve goals Learning about long-term health effects Learning about addiction Getting coaching on my academics and school work Learning about short-term health effects Learning skills for better communication Learning relationship skills Learning about brain functions Getting coaching on changing negative beliefs Understanding the mind-body connection Learning about how the industry works Getting coaching on job and vocational skills Support from my friends Finding a career mentor Learning about different kinds of intelligence Total 224 223 200 166 162 145 118 118 101 98 88 80 61 47 47 40 35 25 22 22 Percentage 72% 71% 64% 53% 52% 46% 38% 38% 32% 31% 28% 26% 20% 15% 15% 13% 11% 8% 7% 7% Peer Educators Peer educators were given a pre-post survey which measured their self-reported confidence, sense of agency/empowerment, and knowledge/skills. The tables below show the statistically significant differences between the pre- and the post-test on questions designed to measure each of these three domains. These findings derive from analysis of variance (ANOVA) testing. Measures of Confidence I don’t feel that comfortable working collaboratively with adults. It's hard for me to explain my values, choices, and actions. I am good at speaking in front of groups of people. I am confident about my ability to speak up. Pre 2.62 2.34 3.30 3.56 Post 2.16 1.91 3.75 3.97 Sig. .018 .024 .020 .023 OUSD TUPE Report 2014-15 © 2015 Moira DeNike Consulting 11 Measures of sense of agency/empowerment I know how to present a workshop. I talk to my friends and family about tobacco, alcohol, and other drugs. I act as an advocate to prevent disease from drugs, alcohol and tobacco. I am someone who promotes health, equality and justice. Measures of knowledge/skills I really understand and can explain the harms of tobacco use. I can explain how the tobacco industry manipulates through marketing techniques. I know how to participate in the political process. I have a number of practical skills that I believe will take me far in life. Pre 3.20 3.09 3.23 Post 3.87 3.69 3.70 Sig. .000 .003 .010 3.54 3.94 .015 Pre 3.72 3.11 Post 4.16 3.90 Sig. .006 .000 3.06 3.71 3.49 4.03 .015 .066 Of 64 Peer Health Leader student responses gathered at the end of the year of service, 95% of respondents (61) indicated that they were “proud” of the work they had done as a Peer Health Leader. Below are some examples of how students responded when asked to say more about that: I feel like I contribute to my school community by letting student know the dangers of using tobacco. I feel proud of the presentation we made to the school board concerning e-cigs. I'm proud of the fact that I get to teach younger kids about various issues & give them the resources to make healthy decisions for themselves. I feel proud of the fact that I was able to correctly educate people on the effects of tobacco and marijuana so that they can make informed decisions about using them. I am also proud of helping to change the rules on the use of e-cigarettes on school campuses. I feel proud that I can make a difference and allow people to understand the effects of tobacco. I can influence people's mind about their choices. That I can help others to stop other people to stop doing drugs so they won’t have less days of life and will not have cancer. I am proud of myself because I stuck with it. Students were also asked what was the best part of being a Peer Health Leader. Below are some examples of their responses: Seeing the effects of less people smoking at school, and students not judging each other. The best part of being a Peer Health Leader is being able to present in front of ~30 students or so and be someone who's able to reach youths about the harm of tobacco and other drugs to let those youths make the decision themselves. The best part is being able to answer questions about the specific aspects of practicing healthy living. OUSD TUPE Report 2014-15 © 2015 Moira DeNike Consulting 12 The best part of being a peer health leader was presenting what we were able to learn & sharing our knowledge. I have loved going to classrooms and educating others on tobacco and answering any questions that they have. For a few students the experience seemed to have had a profound influence. Here are some comments that reflect this: My plan for my future is to go into a profession that helps people become the healthiest them possible. I will continue to stay involved with health advocacy by participating in more health related programs & internships that come my way. I will also inform people about health issues that I know of. I am going to look for a nonprofit organization to volunteer with. I plan to join programs in college that will advocate health issues. School Partnerships School partnership questionnaires were returned from 23 school leaders, from the following schools: Alliance Barack Obama Academy (BOA) Bret Harte Dewey Fremont High Greenleaf (k-8) Madison (6-9) Met West Oakland International Oakland Technical Rudsdale Skyline Street Academy United for Success Academy (UFSA) General Satisfaction with TUPE Partnership The responses show high levels of satisfaction with some aspects of TUPE and moderate levels of satisfaction with others. Survey results demonstrate that school leaders believe that TUPE intervention coaches have the trust and regard of the students. A smaller majority of school leader respondents felt TUPE intervention coaches were supportive of school staff, parents, and general efforts to promote positive school climate. Responses were split on questions of COST support and the effectiveness of prevention education. OUSD TUPE Report 2014-15 © 2015 Moira DeNike Consulting 13 School Leader Satisfaction with TUPE Program Elements The Coach is someone I and students can trust with confidential information The Coach is highly regarded by students whom they have worked with or presented to The Coach is respected by adults on this campus The Coach is interested in supporting staff on handling issues of students and substance abuse Very True The Coach is interested in supporting parents of children with substance abuse issues The Coach listens and responds appropriately to my concerns or suggestions Somewhat True The Coach(s) is a good partner in building a positive school climate Not True/Not Applicable Students with whom the Coach have worked with in either groups or 1 x 1 sessions generally appear to be doing better in school The Coach regularly attends COST meetings or checks in with point person at site The Coach has provided effective prevention education presentations to the students at my site 0% 20% 40% 60% 80% 100% Feedback to Help Improve TUPE-School Partnerships When asked to expound on how they felt the TUPE counselor had or had not supported and coordinated with the work of their site plan, school leaders offered comments which largely reflected a perception that TUPE intervention coaches did not spend enough time on their campuses. Whether framed positively, or negatively, there was a nearly universal recognition that the TUPE intervention coaches OUSD TUPE Report 2014-15 © 2015 Moira DeNike Consulting 14 could not fulfil their potential as a true partner to the school in such a limited number of hours per week at each campus. Below are some examples of survey responses: [The TUPE intervention coach] is a great communicator and empowers students to make better choices. It would be nice to have him more time at our site. We really need him to provide more workshops to students and parents. Was not able to engage with this counselor. S/he was not able to attend COST and this the way that we engage help with engaging the school community and students. S/he is very nice and the students had very good things to say about her counseling services. Needed more check-ins. [The TUPE intervention coach] did great in the one on one counseling sessions, but I felt like I had to chase him/her down for information and updates. It didn't feel like she was a partner-she sort of swooped in an out. I think that's a byproduct of only being on site 3 hours/week. But there were several days s/he didn't show up due to scheduling confusions, etc. I think it makes sense for this person to sit on COST in order to integrate her as part of the team. We would love to have him return, and for his time to be increased beyond 1 day/week. I think the challenges for our TUPE counselor are a reflection on the need being greater than the amount of time allotted for him to be on campus. We are SO happy s/he is with us though – s/he is extremely dedicated to his/her work here and cares greatly about the community. The TUPE Counselor relates well with students and it is very important to build relationships. S/he is not on campus often enough to respond to issues as they arise. If s/he were present more often this would help to reduce suspensions and increase impact. One day/ week is better than 0 days but if the goal is to really make an impact then our TUPE counselor needs to be present a minimum of 3 days per week There were other comments which focused on difficulties in scheduling time with TUPE intervention coaches. The responses show that a majority of participating school leaders found one-on-one services to be the most effective intervention that TUPE intervention coaches provided. What are the most effective services provided by TUPE? 1 x 1 Coaching to reduce substance use Classroom health education on the dangerous… Group life skills education to reduce substance use Parent Education Workshops School Drug Policy Consultation Assemblies on on the dangerous effects of drug use 0% 10% 20% 30% 40% 50% 60% 70% 80% 90% 100% OUSD TUPE Report 2014-15 © 2015 Moira DeNike Consulting 15 Discussion Overall the program was effective in meeting its stated objectives for intervention as well as prevention, and in supporting the personal growth of peer educators. Prevention: Generally the presentations appeared to be effective. Survey responses show what appreciation and curiosity resulting from presentations. The only area for growth that stood out was the rate at which students indicated they would share this information with friends. Intervention: Generally the intervention work appears to have been quite effective, especially in terms of supporting reduced use and building resiliency. Overall, participants were more likely to reduce than to quit (85% indicated reductions by half or more). And, while reductions were maintained and even shown to have increased during the follow-up administration of the survey, student respondents were less likely to indicate that they were in the process of quitting in the follow-up survey. This suggests that with ongoing support students may find it easier to reduce their use, but that quitting altogether is a more challenging task. This is consistent with literature which shows that relapse is an anticipated part of addiction recovery (Polivy & Herman, 2002). Recent research, however, has found that reduction is as legitimate a path toward quitting entirely as is attempted abstinence (Lindson-Hawley et al., 2012), which shines a more positive light on these findings. Peer Educators: Peer educators showed statistically significant growth on indicators in each of the three domains: self-reported confidence, sense of agency/empowerment, and knowledge/skills. There were some areas where peer educators did not show growth, for example, listening and empathy, commitment and belonging to school, and the belief that they will be successful in life. Mean baseline scored on these indicators were generally above 3.5, a relatively high average. School Partnership: The quality of the TUPE-school partnership was revealed to have some room for growth. While several school leaders reported that the TUPE counselor was highly valuable, their inability to consistently participate in COST meetings and to be reliably present on campus significantly hindered the quality of the partnership. There was also a relatively weak level of enthusiasm from school leaders about the impact of classroom presentation. This perception is not consistent with the findings from the post-presentation student surveys, but is worth investigating. Conclusion & Recommendations In conclusion, 2014-15 was generally a very successful programmatic year for TUPE. The program met a high level of deliverables (outputs), and achieved impact at multiple levels. Findings from the analysis also revealed some room for growth. The following recommendations should be taken under consideration by OUSD program leadership: Include direct messaging in classroom presentations for students to talk with their peers about what they have learned. OUSD TUPE Report 2014-15 © 2015 Moira DeNike Consulting 16 Talk with school leaders, COST members, teachers, and students about the content, format, and style of classroom presentations to better understand why there is a disconnect between school leaders’ perception of the presentations and the student survey data. Explore ways to expand the number of hours TUPE intervention coaches can spend on each campus, to ensure regular COST meeting attendance and deeper partnership with school sites. References Lindson-Hawley, N., Aveyard, P., Hughes, J.R.. (2012) "Reduction versus abrupt cessation in smokers who want to quit." Cochrane Database of Systematic Reviews 2012, Issue 11. Art. No.: CD008033. Faggiano F, Minozzi S, Versino E, Buscemi D. Universal school-based prevention for illicit drug use. Cochrane Database of Systematic Reviews 2014, Issue 12. Art. No.: CD003020. Polivy, J., & Herman, C.P. (2002). "If at first you don't succeed: False hopes of self-change." American Psychologist, 57(677-689). OUSD TUPE Report 2014-15 © 2015 Moira DeNike Consulting 17
