Investigation of Alternative Reducing Agent Injection into the
advertisement
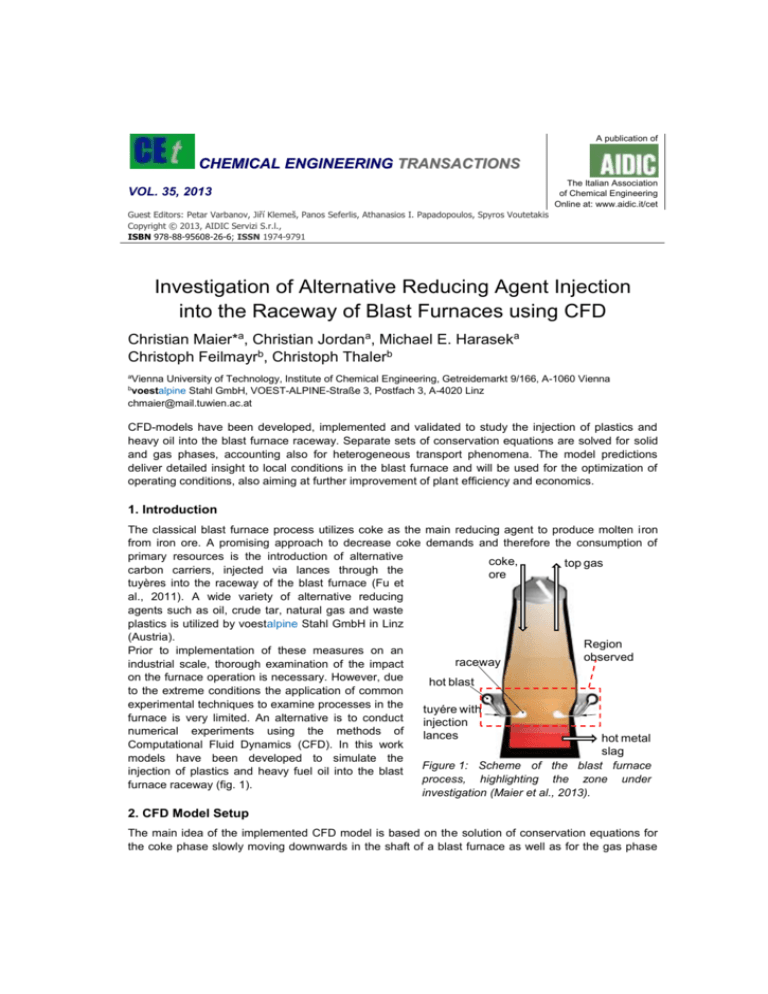
A publication of CHEMICAL ENGINEERING TRANSACTIONS VOL. 35, 2013 The Italian Association of Chemical Engineering Online at: www.aidic.it/cet Guest Editors: Petar Varbanov, Jiří Klemeš, Panos Seferlis, Athanasios I. Papadopoulos, Spyros Voutetakis Copyright © 2013, AIDIC Servizi S.r.l., ISBN 978-88-95608-26-6; ISSN 1974-9791 Investigation of Alternative Reducing Agent Injection into the Raceway of Blast Furnaces using CFD Christian Maier*a, Christian Jordana, Michael E. Haraseka Christoph Feilmayrb, Christoph Thalerb a Vienna University of Technology, Institute of Chemical Engineering, Getreidemarkt 9/166, A-1060 Vienna voestalpine Stahl GmbH, VOEST-ALPINE-Straße 3, Postfach 3, A-4020 Linz chmaier@mail.tuwien.ac.at b CFD-models have been developed, implemented and validated to study the injection of plastics and heavy oil into the blast furnace raceway. Separate sets of conservation equations are solved for solid and gas phases, accounting also for heterogeneous transport phenomena. The model predictions deliver detailed insight to local conditions in the blast furnace and will be used for the optimization of operating conditions, also aiming at further improvement of plant efficiency and economics. 1. Introduction The classical blast furnace process utilizes coke as the main reducing agent to produce molten iron from iron ore. A promising approach to decrease coke demands and therefore the consumption of primary resources is the introduction of alternative coke, top gas carbon carriers, injected via lances through the ore tuyères into the raceway of the blast furnace (Fu et al., 2011). A wide variety of alternative reducing agents such as oil, crude tar, natural gas and waste plastics is utilized by voestalpine Stahl GmbH in Linz (Austria). Region Prior to implementation of these measures on an observed raceway industrial scale, thorough examination of the impact on the furnace operation is necessary. However, due hot blast to the extreme conditions the application of common experimental techniques to examine processes in the tuyére with furnace is very limited. An alternative is to conduct injection numerical experiments using the methods of lances hot metal Computational Fluid Dynamics (CFD). In this work slag models have been developed to simulate the Figure 1: Scheme of the blast furnace injection of plastics and heavy fuel oil into the blast process, highlighting the zone under furnace raceway (fig. 1). investigation (Maier et al., 2013). 2. CFD Model Setup The main idea of the implemented CFD model is based on the solution of conservation equations for the coke phase slowly moving downwards in the shaft of a blast furnace as well as for the gas phase that counter-currently moves upwards, to be withdrawn at the top of the furnace. Inter-phase exchange is modeled by implementing mathematical expressions describing the physical processes. Injection of auxiliary reducing agents and the release of the injected material is modeled applying a Lagrangian frame of reference. Boundary conditions necessary to complete the definition of the set of conservation equations such as droplet size distribution from oil injection and thermophysical properties of plastic particles are determined experimentally (Jordan et al., 2010). A detailed description of the heterogeneous reaction model including expressions for diffusion processes, heterogeneous heat transfer and various submodels can be found elsewhere (Maier et al., 2012a; Maier et al., 2012b; Maier et al., 2013). 3. Model Validation The model setup was validated in multiple steps, starting from simple processes involving heterogeneous heat transfer at various temperature levels, gradually increasing the complexity towards homogeneous gas-phase reactions and finally arriving at cases involving heterogeneous gas-solid reactions. The idea of thorough model verification was realized such that experimental setups from literature were adopted and implemented into a CFD model, simulation results were compared to experimental data to evaluate the reliability of the modeling tool. Herein the main focus of attention is put on the analysis of the gasification model dealing with an important heterogeneous reaction in the blast furnace: CO2-gasification of coke, also termed “solution loss reaction”. As this reaction proceeds, carbon monoxide is released that is utilized for indirect iron oxide reduction. 3.1 Experimental Configuration A method for the experimental estimation of the reactivity of metallurgical coke in a CO2-atmosphere that is widely applied in the iron producing industry since its introduction in the 1970s is the so-called NSC-test (named after the inventor, the Nippon Steel Corporation). In this testing procedure, 200 g coke in the size range of 19 – 21 mm is gasified with carbon dioxide at a temperature of 1100 °C. product gas gasification agent UDF gas zone coke bed heating zone I steel housing (heat conduction) solid zone gasification products heating zone II ceramic pebbles bed zone heating zone III perforated plate gasification agent Figure 2: Schematic illustration of the NSC-test (left) and its implementation in the CFD-model (right). The test is operated as a batch-process, its standard duration is 2 hours. After gasification, the percentual weight loss is evaluated (termed Coke Reactivity Index, CRI). The remaining coke is subjected to mechanical stresses in a tumbling Table 1: List of experiments and range of drum to determine the Coke Strength after parameter variation. Reactant gas flow applied Reaction, CSR (Diez et al., 2002). to all experiments: 5 l/min(STP). Consequently, in this testing procedure coke to be T dp CO2, inlet N2, inlet used in the blast furnace process is characterized exp. no. [°C] [mm] [%(v/v)] [%(v/v)] in terms of reactivity as well as its resistance to 1 1100 100 0 mechanical loads, two very important parameters 2 1100 25 75 responsible for stable and efficient operation of 19 – 22.4 3 1000 100 0 the blast furnace. 4 1000 50 50 A general schematic illustration of the 5 1100 8 – 10 100 0 experimental setup of the NSC-test is shown on the left side in fig. 2. The coke is placed on a tray inside the oven that is heated to the desired gasification temperature. Gas moves through the coke bed from bottom to the top, heterogeneous reactions take place on the surface as well as in the pore structures of the coke particles, consuming the gasification agents and releasing the gasification products that are withdrawn on the top of the oven. The right sketch in fig. 2 shows the implementation of this experimental apparatus in the CFD-model, highlighting the aforementioned grid zones for the coke and the gas phase, respectively. Conservation equations are solved for both zones, inter-phase exchange (e.g. heterogeneous heat transfer and heterogeneous reactions) is calculated by implementing source terms in the governing equation sets evaluating local driving forces, such as temperature differences in the case of heat transfer. In the standardized testing routine, coke is gasified at the above mentioned conditions and the overall coke consumption rate is estimated. The experiments conducted in the current work (by voestalpine Stahl) include the continuous measurement of the product gas composition using mass spectrometry. Consequently, concentration profiles can be used for comparison with the simulation results, being very valuable for validation purposes. Furthermore, apart from the standard routine the operating conditions were varied in terms of gasification temperature, composition of the gasification agent as well as size of the metallurgical coke (see a summary in table 1; standard conditions: exp. 1). 3.2 Simulation Results Calculated rates of coke depletion due to CO2 gasification for the range of experimental conditions are shown in fig. 3. In general, highest reaction rates appear near the bottom of the coke bed, as the partial pressures of carbon dioxide are highest in this region. Significant differences (approx. factor 5) between gasification rates for the conditions studied were found. Highest reactivity appears for the case with smaller coke particles (exp. 5), being precipitated by higher specific surface of the particles as well as Figure 3: Vertical profile of coke consumption rates due to the diffusion issues inside the solution loss reaction, experimental conditions as listed in table 1. particles: Smaller particle sizes allow for shorter diffusion distances of reaction educts in internal pore structures to the actual reaction sites. Consequently, a larger fraction of the inner particle surface is involved in heterogeneous reactions, increasing the overall rates of reaction (Liu and Niksa, 2004). The rates of boundary layer and pore diffusion, intrinsic reaction rates and the resulting effective reaction rates for the experiments no. 2 and 5 are shown in fig. 4. At low temperatures, the limiting factor for the overall reaction rate is given by intrinsic reaction rates of CO2 with solid coke. With increasing temperature, this rate increases exponentially, while the rate of boundary layer diffusion increases only in the order of T1.75 (Maier et al., 2012a). Therefore, at high temperatures the concentration of educts inside coke particles declines and the diffusive transport of educt species through the boundary layer towards the particle surface Figure 4: Reaction rates at mean concentration in the becomes the main resistance. At coke bed, thick lines: exp. 2, thin lines: exp. 5. intermediate temperatures, the diffusion of educts inside porous particle structures plays an important role, while at low and very high temperatures the effective reaction rate asymptotically approaches the intrinsic and the rate of boundary layer diffusion, respectively. As carbon dioxide is consumed, CO is released into the voids of the coke bed (see fig. 5). Figure 5: Profiles of CO2 and CO mole fractions along the coke bed. exit gas composition [mol/mol] 1 exp. no. 1 1 exp. no. 2 1 exp. no. 3 1 exp. no. 4 1 0.8 0.8 0.8 0.8 0.8 0.6 0.6 0.6 0.6 0.6 0.4 0.4 0.4 0.4 0.4 0.2 0.2 0.2 0.2 0.2 0 0 CO2 CO N2 0 CO2 CO N2 0 0 CO2 CO N2 exp. no. 5 CO2 CO N2 CO2 CO N2 EXP CFD Figure 6: Product gas composition, comparison of exp. data and CFD results (major gas constituents). The comparison of product gas composition for the various experimental runs to the simulation results is shown in fig. 6. Very good agreement was found for the range of parameter variation, indicating that the model is able to capture and reproduce the main physical processes involved in CO 2 gasification of coke. 4. Blast Furnace Simulation The validated CFD model is applied to the actual blast furnace process (BF A, voestalpine Stahl porosity [-] Linz), focussing on the region in the vicinity of the 1.0 tuyères (see also fig. 1). Simulation results for 0.8 operating conditions featuring maximum plastic 0.6 injection rates (96 kg/t hot metal) at heavy fuel oil 0.4 rates adjusted accordingly (39 kg/t hot metal) are 0.2 presented in the following. 0 Near the tuyère opening, a cavity is formed in the cokebed by the injection of hot blast, called raceway. The size and shape of this zone states an Figure 1: Contours of cokebed porosity, as important boundary condition, as it determines e.g. applied in the CFD model. the travelling distance of injected auxiliary reducing agents prior to interaction with solid coke. In the CFD-model the raceway is defined by implementing a spatially variable porosity distribution that is adopted from literature sources (Zhou, 2008). Oxygen injected with hot blast is readily consumed in the vicinity of the tuyère by heterogenous reaction with the coke and combustion of injected reducing agents, resulting in the release of CO2 as well as heat of reactions (see fig. 7). After leaving the raceway cavity, carbon dioxide is consumed by the solution loss reaction, producing CO that is utilized for iron oxide reduction. Involved reduction reactions are endothermic, the heat necessary is delivered by the oxidation reactions. CO2 gas [oC] [mol/mol] ≥ 0.25 ≥3000 0.20 2600 0.15 2200 0.10 1800 0.05 1400 0 ≤1000 Figure 7: Left: Contours of CO2 mole fraction. Right: Gas-phase temperature field. plastic [g/s] 1.0 ε = 0.7 ε = 0.8 ε = 0.9 ε = 0.6 fuel oil [g/s] 0.15 0.8 0.12 0.6 0.09 0.4 0.06 0.2 0.03 0 0 Figure 8: Tracks of injected auxiliary reducing agents, colored by mass release rates. Iso-surfaces, colored by local coke bed void fraction ε, defining the shape of the raceway cavity. Due to the high specific surface of the small droplets from fuel oil spray, oil vaporization for droplets with initially 200 µm diameter is completed after comparatively short residence times in the range of 13 ms (see fig. 8).Contrary to this, plastic particles (mean diameter of 7 mm) reach the boundary of the raceway cavity before pyrolysis is completed (flight time approx. 0.1 s). In the simulation, particles are modeled to impact on the coke bed, releasing the remaining particle volatiles in place. The pyrolysis products are subjected to homogeneous reactions in the gas phase involving further breakdown to smaller hydrocarbons (e.g. CH4) and oxidation reactions. 5. Conclusions and Outlook A multiphase model describing the conditions in the vicinity of the tuyères of a blast furnace was developed and successfully validated for a number of processes. The model also incorporates a description of dispersed phases, representing injected auxiliary reducing agents. Model development was done in conjunction with experimental work to gain data for validation purposes as well as to define boundary conditions for CFD simulations. Future work will include the extension of the width of parameter variation for heterogeneous coke reactions, aiming for higher temperatures (CO2 gasification) and also other gasification agents (e.g. steam gasification) by conducting thermogravimetric analysis. The model predictions for the blast furnace process will be used to support the optimization procedure for injection of auxiliary reducing agents, aiming at a decrease of the environmental impact of iron production via the blast furnace route and also at the further improvement of plant efficiency and economics. Acknowledgements The presented work has been funded by K1-MET and FFG Forschungsförderungsgesellschaft, Austria. References Diez, M.A., Alvarez, R., Barriocanal, C., 2002. Coal for metallurgical coke production: predictions of coke quality and future requirements for cokemaking. Coal Geology, 50, 389-412. Fu, D., Zheng, D., Zhou, C.Q., d’Alessio, J., Ferron, K., Zhao, Y., 2011. Parametric studies on PCI performances. Proceedings of the ASME/JSME 2011 8th Thermal Engineering Joint Conference, May 13-17, 2002, Honolulu, Hawaii, USA. Jordan, C., Harasek, M., El-Gohari, A., Feilmayr, C., Schuster, S., 2010. Combined Injection of Plastic Particles and Heavy Fuel Oil into a Blast Furnace Raceway - Detailed CFD Analysis. European Conference on Computational Fluid Dynamics, ECCOMAS CFD, June 14-17 2010, Lisbon, Portugal. Liu, G.S., Niksa, S., 2004. Coal conversion submodels for design applications at elevated pressures. Part II. Char gasification. Progress in Energy and Combustion Science, 30(6), 679-717. Maier, C., Jordan, C., Harasek, M., Feilmayr, C., Thaler, C., 2012a. Implementation and Validation of a Three-Dimensional Multiphase-CFD-Model for Blast Furnace Processes. Chemical Engineering Transactions, 29, 925-930. Maier, C., Jordan, C., Harasek, M., Feilmayr, C., Thaler, C., 2012b. Development and Validation of a CFD-Model for Heterogeneous Transfer Phenomena in Blast Furnace Processes. 5th International Conference from Scientific Computing to Computational Engineering IC-SCCE, July 4-7 2012, Athens, Greece. Maier, C., Jordan, C., Harasek, M., Feilmayr, C., Thaler, C., 2013. CFD-Simulation of the Blast Furnace Process: Injection of Heavy Oil and Plastic Particles into the Raceway, May 6-9 2013, Pittsburgh, PA, USA, accepted for publication. Zhou, C.Q., 2008, CFD Modeling for High Rate Pulverized Coal Injection (PCI) into the Blast Furnace, Purdue University - Calumet, Dept. of Mechnaical Engineering, Rep.-Nr.: DE-FC36-97ID13554, October 2008.
