aic14098-sup-0001-suppinfo
advertisement
Supplemental Material: Mathematical model (SI system)
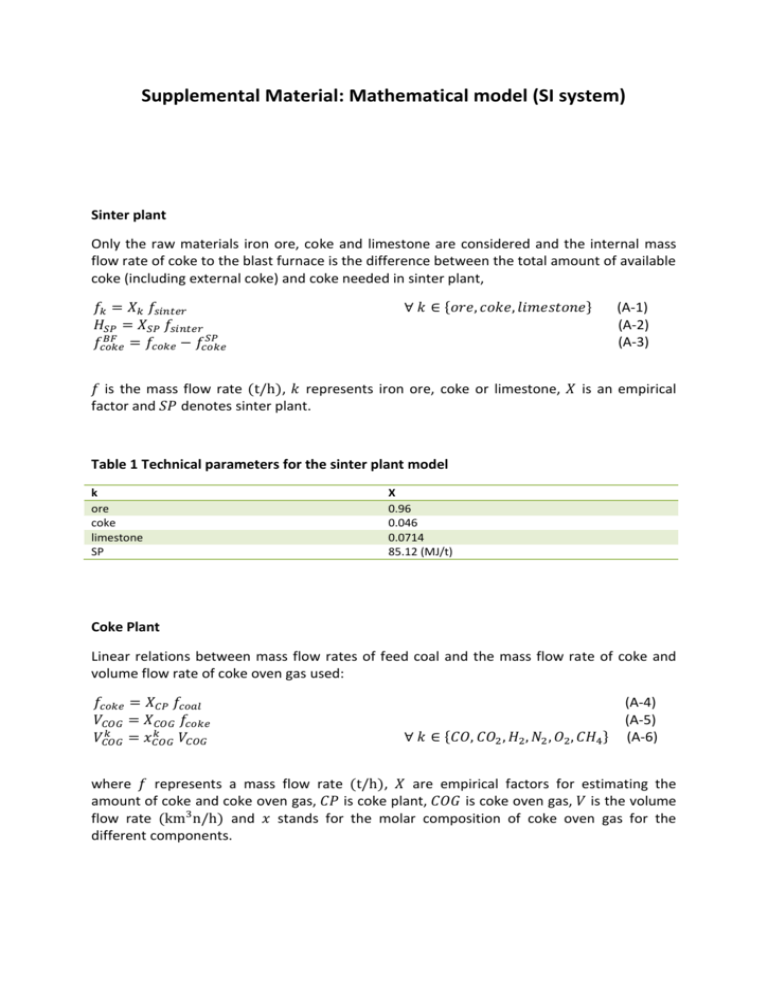
Sinter plant
Only the raw materials iron ore, coke and limestone are considered and the internal mass
flow rate of coke to the blast furnace is the difference between the total amount of available
coke (including external coke) and coke needed in sinter plant,
𝑓𝑘 = 𝑋𝑘 𝑓𝑠𝑖𝑛𝑡𝑒𝑟
𝐻𝑆𝑃 = 𝑋𝑆𝑃 𝑓𝑠𝑖𝑛𝑡𝑒𝑟
𝑆𝑃
𝐵𝐹
𝑓𝑐𝑜𝑘𝑒
= 𝑓𝑐𝑜𝑘𝑒 − 𝑓𝑐𝑜𝑘𝑒
∀ 𝑘 ∈ {𝑜𝑟𝑒, 𝑐𝑜𝑘𝑒, 𝑙𝑖𝑚𝑒𝑠𝑡𝑜𝑛𝑒}
(A-1)
(A-2)
(A-3)
𝑓 is the mass flow rate (t/h), 𝑘 represents iron ore, coke or limestone, 𝑋 is an empirical
factor and 𝑆𝑃 denotes sinter plant.
Table 1 Technical parameters for the sinter plant model
k
ore
coke
limestone
SP
X
0.96
0.046
0.0714
85.12 (MJ/t)
Coke Plant
Linear relations between mass flow rates of feed coal and the mass flow rate of coke and
volume flow rate of coke oven gas used:
𝑓𝑐𝑜𝑘𝑒 = 𝑋𝐶𝑃 𝑓𝑐𝑜𝑎𝑙
𝑉𝐶𝑂𝐺 = 𝑋𝐶𝑂𝐺 𝑓𝑐𝑜𝑘𝑒
𝑘
𝑘
𝑉𝐶𝑂𝐺
= 𝑥𝐶𝑂𝐺
𝑉𝐶𝑂𝐺
∀ 𝑘 ∈ {𝐶𝑂, 𝐶𝑂2 , 𝐻2 , 𝑁2 , 𝑂2 , 𝐶𝐻4 }
(A-4)
(A-5)
(A-6)
where 𝑓 represents a mass flow rate (t/h), 𝑋 are empirical factors for estimating the
amount of coke and coke oven gas, 𝐶𝑃 is coke plant, 𝐶𝑂𝐺 is coke oven gas, 𝑉 is the volume
flow rate (km3 n/h) and 𝑥 stands for the molar composition of coke oven gas for the
different components.
Table 2 Technical parameters for the coke plant model
k
CO
CO2
H2
O2
N2
CH4
x
0.0528
0.0177
0.5807
0.0014
0.0646
0.2828
COG
CP
0.3197
0.6742
Hot Stoves
The volume flow rate of blast and energy needed for the hot stoves is estimated by an
efficiency factor of 0.6885. The heat is assumed to be generated by using internal fuel (off
gases) and/or external oil supply.
𝐵𝐹
𝑉 = 𝑉𝑏𝑙𝑎𝑠𝑡
𝑜𝑢𝑡
𝑖𝑛
∆𝐻𝐻𝑆 = 𝜂𝐻𝑆 (𝐻𝐻𝑆
− 𝐻𝐻𝑆
)
𝐵𝐹
𝑉𝑂2 = 𝑉𝑏𝑙𝑎𝑠𝑡
𝑒𝑛𝑟𝑖𝑐ℎ𝑚𝑒𝑛𝑡
(A-7)
(A-8)
(A-9)
where 𝐵𝐹 is the blast furnace, 𝐻𝑆 is hot stoves, ∆𝐻 is the difference between the
enthalpies, 𝐻 is the enthalpy (of input and output streams) and 𝜂 stands for the hot stove
efficiency factor.
Basic oxygen furnace
The production of liquid steel is taken to be proportional to the amount of hot metal and
scrap. We assumed 50% recovery of BOF off gases with fixed composition of CO and CO2 of
0.9 and 0.1, respectively.
𝐵𝐹
𝑓𝑙𝑠 = (1.1453). 𝑓𝐻𝑀
𝐵𝑂𝐹
𝐵𝐹
𝑉𝐵𝑂𝐹𝐺
= (0.0415). 𝑓𝐻𝑀
𝐵𝐹
𝑉𝑂𝐵𝑂𝐹
= (0.4562) . 𝑓𝐻𝑀
2
𝐵𝑂𝐹
𝐵𝐹
𝑓𝑆𝑐𝑟𝑎𝑝
= (0.25). 𝑓𝐻𝑀
𝐵𝑂𝐹
𝐵𝐹
𝑓𝑙𝑖𝑚𝑒𝑠𝑡𝑜𝑛𝑒
= (0.06657). 𝑓𝐻𝑀
(A-10)
(A-11)
(A-12)
(A-13)
(A-14)
where 𝑓 is mass flow rate (t/h), 𝑙𝑠 is liquid steel, 𝐻𝑀 is hot metal, 𝐵𝑂𝐹 is basic oxygen
furnace, 𝐵𝑂𝐹𝐺 is basic oxygen furnace off gases.
Power Plant
The power plant is modeled in a way which produces utility requirements for the whole
plant and external electricity and district heat based on demand or price as byproduct. The
internal fuels (off gases) and oil is used as feedstock. The technical data is presented below:
Table 3 Data for power plant model
Efficiency
Turbine
[Steam, 75 bar 5 bar]
Production of District Heat
[Heat Exchanger, Tout=60 ’C]
Production of electricity
[Generator]
η
0.79
0.9
0.95
Blast Furnace
The general model for the blast furnace is described in the Appendix of ref. 8. For the sake of
simplicity a surrogate model based on PLS and Kriging has been used in the present study
BF
𝑍𝑚
= 𝐴1,𝑚 + ∑ 𝐴2,𝑚,𝑛 𝑋𝑛BF
49
(A-15)
𝑛
BF
2 )
𝑍̂𝑚
= 𝜇𝑚 + ∏ 𝛾𝑠𝑗 exp(−𝜃𝑚𝑛 𝑑𝑛𝑠
(A-16)
𝑠=1
2
𝑑𝑛𝑠
= (𝑋𝑛BF − 𝑤𝑠𝑛 )
(A-17)
where 𝐴1,𝑚 and 𝐴2,𝑚 are regression coefficients, 𝑋𝑛BF (n = 1,..,5) stands for the hot metal
production (t/h), specific oil rate, pellet rate (kg/t hm ), blast oxygen content (%), or blast
temperature (C) that are the five inputs to the blast furnace model. The fifteen outputs
BF
𝑍̂𝑚
(𝑚 = 1, … ,15) in the surrogate model are the specific coke rate (kg/t hm ), volume flow
rate of top gases (km3 n/h), composition of top gases (H2 , N2 , CO2 , CO), top gas
temperature (C), sinter rate (kg/t hm ), blast volume flow rate (m3 n/h), (raceway) flame
temperature (C), burden residence time (h), bosh gas volume (km3 n/h), limestone rate
(kg/t hm ), quartzite rate (kg/t hm ) and slag rate (kg/t hm ), 𝜇𝑚 is the generalized least
2
squares estimate for the polynomial term, 𝜃𝑚𝑛 is the correlation function parameters, 𝑑𝑛𝑠
=
BF
(𝑋𝑛 − 𝑤𝑠𝑛 ) are the differences between a point and the design sites 𝑤𝑠𝑛 , and 𝑠 is the
number of random points that have been generated by the Latin hypercube method. The
Kriging method has been used to estimate the last three terms based on s = 49 random input
points.
Table 4 Regression coefficients after scaling of the blast furnace-PLS model
Coke rate
Top
Gas
Volume
CO
Composition
O2
Composition
H2
Composition
N2
Composition
Top
Gas
Temp.
Sinter Rate
O2 Volume
flow rate
Blast Volume
Rate
Flame
Temperature
Residence
time
Basicity
Slag
flow
Rate
Bosh
Gas
Volume
Hot Metal
Oil Rate
-0.005014
1.4760350
-1.025237
0.1237624
-0.0000019
Pellet Rate
Blast
Temperature
-0.10781
-0.06647
A1
-0.009983
-0.004576
O2
Enrichment
-0.278994
-5.187665
-0.000173
-0.00001
0.005796
-0.00000407
0.1058
0.0000009
-0.000182
0.000018
0.0054725
0.00003593
0.0578
0.0000033
0.0004412
-0.00000088
0.0013414
0.00001247
-0.0349
-0.0000023
-0.000085
-0.00000716
-0.0126100
-0.00004434
0.8712
0.0175255
1.095010
-0.02639143
-16.06648
-0.16139
657.704
0.0001598
76.819234
-0.000373
7.218492
-1.080164
-0.529055
0.002875
1267.9047
0.00001888
-4.832905
1572.14
30928.3
957.52657
54.53718
-5.095824
-5167.110
-56.48740
192363.2
-0.0193695
-3.326163
-0.016224
36.97700
0.624802
890.11
-0.0493425
0.012907
0.000237
0.004898
0.001405
11.162
0.0000080
-0.0224216
0.0006239
-0.021151
0.00004875
-0.117201
0.000327
-0.415930
-0.00001126
-0.0128152
0.9652
306.777
1354.9086
234.06044
-6.650835
-5182.449
-73.412888
191684.33
581.644
195.454
Membrane Process
The operational pressure and molar flow rate (𝐤𝐦𝐨𝐥/𝐡) of the membrane process is
estimated by
𝑙𝑜𝑤
𝑃𝑀𝐸𝑀
ℎ𝑖𝑔ℎ
𝑃𝑀𝐸𝑀
𝐹
=(
𝑦𝐻2𝑀𝐸𝑀
𝑝
𝑦𝐻2𝑀𝐸𝑀
𝑝
)(
𝐹
1 − 𝜁𝐻𝑀𝐸𝑀
2
𝐹
1 − 𝑦𝐻2𝑀𝐸𝑀 𝜁𝐻𝑀𝐸𝑀
2
)
(A-18)
𝑓𝐻2𝑀𝐸𝑀 = 𝜁𝐻𝑀𝐸𝑀
𝑓𝐻2𝑀𝐸𝑀
2
(A-19)
𝑝
𝑓𝑘 𝑀𝐸𝑀
𝐹
𝐹
𝛼{𝑘⁄𝐻2 } 𝜁𝐻𝑀𝐸𝑀
𝑦𝑘 𝑀𝐸𝑀 𝑓𝐻2𝑀𝐸𝑀
2
=
𝐹
𝑦𝐻2𝑀𝐸𝑀
𝑏𝑝𝑀𝐸𝑀
𝑓𝐻2
[2 −
𝜁𝐻𝑀𝐸𝑀
2
(A-20)
𝑝
𝑙𝑜𝑤
𝑦𝐻2𝑀𝐸𝑀 𝑃𝑀𝐸𝑀
−
]
−
2
[
] (1 − 𝛼{𝑘⁄𝐻2 } )
𝐹
ℎ𝑖𝑔ℎ
1 − 𝑦𝐻2𝑀𝐸𝑀 𝜁𝐻𝑀𝐸𝑀
𝑃
𝑀𝐸𝑀
2
𝛼(𝑘⁄𝐻2 ) 𝜁𝐻𝑀𝐸𝑀
2
𝐹
= (1 − 𝜁𝐻𝑀𝐸𝑀
)𝑓𝐻2𝑀𝐸𝑀
2
(A-21)
𝑏𝑝𝑀𝐸𝑀
𝑓𝑘
𝐹
𝑝
= 𝑓𝑘 𝑀𝐸𝑀 − 𝑓𝑘 𝑀𝐸𝑀
(A-22)
ℎ𝑖𝑔ℎ
𝑃𝑀𝐸𝑀
𝐹
𝑝
where
and
are the product and feed stream pressures, 𝑦𝐻2𝑀𝐸𝑀 and 𝑦𝐻2𝑀𝐸𝑀 are
the mole fraction of hydrogen in feed and in the product streams and 𝜁𝐻𝑀𝐸𝑀
is membrane
2
𝑝𝑀𝐸𝑀
hydrogen product recovery, 𝑓𝐻2
is the molar flow rate of hydrogen in the product stream,
𝑝𝑀𝐸𝑀
𝑏𝑝
𝑓𝑘
is the molar flow rate of other components available in the product stream, 𝑓𝐻2 𝑀𝐸𝑀 is
𝑏𝑝
the molar flow rate of hydrogen in the byproduct, 𝑓𝑘 𝑀𝐸𝑀 is the molar flow rate of other
𝑙𝑜𝑤
𝑃𝑀𝐸𝑀
components in the byproduct stream and 𝛼{𝑘⁄𝐻2 } is the ratio of permeability coefficient of
other components available in the stream to hydrogen.
Table 5 Permeability coefficient for components in stream
Component
CO
CH4
CO2
H2
O2
N2
Permeability
2.4
2.3
38
55
8.3
1.4
Pressure Swing Adsorption Process
The operational pressure and molar flow rate (kmol/h) are expressed as
𝑙𝑜𝑤
𝑃𝑃𝑆𝐴
ℎ𝑖𝑔ℎ
𝑃𝑃𝑆𝐴
𝐹
= 𝑦𝐻2𝑃𝑆𝐴 (1 −
𝑝
𝑅𝑃𝑆𝐴
)
1 − 𝛽𝑃𝑆𝐴
(A-23)
𝐹
𝑓𝐻2𝑃𝑆𝐴 = 𝑅𝑃𝑆𝐴 𝑓𝐻2𝑃𝑆𝐴
𝑏𝑝𝑃𝑆𝐴
𝑓𝐻2
𝑏𝑝𝑃𝑆𝐴
𝑓𝑘
𝐹
(A-24)
𝑝
= 𝑓𝐻2𝑃𝑆𝐴 − 𝑓𝐻2𝑃𝑆𝐴
(A-25)
𝐹
= 𝑓𝑘 𝑃𝑆𝐴
(A-26)
ℎ𝑖𝑔ℎ
𝑙𝑜𝑤
where 𝑃𝑃𝑆𝐴
and 𝑃𝑃𝑆𝐴 are the low and high absolute pressure of the pressure swing cycle,
𝐹𝑃𝑆𝐴
𝑦𝐻2 is the mole fraction of the hydrogen in the feed, 𝑅𝑃𝑆𝐴 is the product recovery and βPSA
𝑝
𝐹
is the adsorbent selectivity value, 𝑓𝐻2𝑃𝑆𝐴 is the molar flow rate of the product stream, 𝑓𝐻2𝑃𝑆𝐴
𝑏𝑝𝑃𝑆𝐴
is the molar flow rate of hydrogen in the feed stream, 𝑓𝐻2
𝑏𝑝
𝑓𝑘 𝑃𝑆𝐴
is the molar flow rate of
hydrogen in the byproduct stream and
is the molar flow rate of other components in
the byproduct stream. In practice the value of the hydrogen recovery is less than 0.92 and
for the adsorbent selectivity would be greater than 0.02.
Reactors
The molar flow rates for the gas reforming units are calculated by (linear) mass balances for
fixed conversion reactor with NR parallel reactions for each component, 𝑘, and can be
expressed as
𝑁𝑅
𝑓𝑝𝑘
=
𝑓𝐹𝑘
+ ∑ 𝛾𝑟𝑘 𝑥𝑟 𝑓𝐹𝑙(𝑟)
(A-27)
𝑟=1
where 𝑟 is the number of reaction, 𝑙(𝑟) is the limiting component, 𝛾𝑟𝑘 is the stoichiometric
coefficients which is positive, negative and zero for product, reactant and inert components
and 𝑥𝑟 is the fraction converted per pass based on limiting reactant.
Table 6 operation condition for different gasification process
Reactor
SMR
CDR
POR
LPMEOH
GPMEOH
Operational condition
CH4/H2O=3.681, P=20 bar, T=1153-1300 K
𝑆𝑀𝑅
𝑆𝑀𝑅
𝑥𝐶𝐻
= 81.46, 𝑥𝐶𝑂
= 40.2
4
CH4/CO2=1, P=1 bar, T=1143-1313 K
𝒙𝑪𝑫𝑹
𝑪𝑯𝟒 = 𝟎. 𝟗𝟎
CH4/O2=2, P=1 bar, T=1073-1473 K
𝒙𝑷𝑶𝑹
𝑪𝑯𝟒 = 𝟎. 𝟗𝟓
H2/CO≥2, P=50 bar, T=523 K
𝒙𝑳𝑷𝑴𝑬𝑶𝑯
= 𝟖. 𝟗, 𝒙𝑳𝑷𝑴𝑬𝑶𝑯
= 𝟑𝟎. 𝟔
𝑪𝑶𝟐
𝑪𝑶
H2/CO≥2, P=50 bar, T=533 K
𝒙𝑮𝑷𝑴𝑬𝑶𝑯
= 𝟗𝟓, 𝒙𝑮𝑷𝑴𝑬𝑶𝑯
= 𝟗𝟓
𝑪𝑶𝟐
𝑪𝑶
Compressors
The reference case of the compressor is assumed to operate isentropically, and the true
operation is estimated with adiabatic, motor drive and mechanical efficiencies of 𝜂𝑎𝑑 = 0.9,
𝜂𝑚𝑑 = 0.9 and 𝜂𝑚𝑒𝑐ℎ = 0.85, respectively,
𝑇𝑜𝑢𝑡
𝑃𝑜𝑢𝑡 (𝛾̅−1)⁄𝛾̅
=(
)
𝑇𝑖𝑛
𝑃𝑖𝑛
∑𝑘 𝑓𝑘 (𝐻𝑜𝑢𝑡,𝑘 − 𝐻𝑖𝑛,𝑘 )
𝑊𝑐𝑜𝑚𝑝 =
𝜂𝑎𝑑 𝜂𝑚𝑑 𝜂𝑚𝑒𝑐ℎ
𝑓𝑖𝑛,𝑐𝑜𝑚𝑝 = 𝑓𝑜𝑢𝑡,𝑐𝑜𝑚𝑝
(A-28)
(A-29)
(A-30)
where 𝑇out and 𝑇in are the outlet and inlet absolute temperatures, 𝑃out and 𝑃in are the
outlet and inlet pressures, 𝛾̅ is the average of specific heat ratio of the components in
question and 𝑊𝑐𝑜𝑚𝑝 is the compressor work.
Separation columns
For distillation columns the composition of component in product is specified. The
operational condition is presented in Table 7. The energy balance is expressed as
𝛥𝐻𝑟𝑒𝑏. = 𝛥𝐻𝑐𝑜𝑛𝑑. + 𝛥𝐻𝑠𝑒𝑛𝑠𝑖𝑏𝑙𝑒
(A-31)
𝛥𝐻𝑐𝑜𝑛𝑑. = ∑𝑘=𝑐𝑜𝑚𝑝𝑜𝑛𝑒𝑛𝑡𝑠 𝑖𝑛(𝑅̅ + 1) 𝑓𝑘 𝐻𝑘𝑉
(A-32)
𝑑𝑖𝑠𝑡𝑖𝑙𝑙𝑎𝑡𝑒 𝑠𝑡𝑟𝑒𝑎𝑚
𝛥𝐻𝑠𝑒𝑛𝑠𝑖𝑏𝑙𝑒 =
∑
𝑓𝑘 𝐶𝑃𝑘 𝛥𝑇𝑠𝑒𝑛𝑠𝑖𝑏𝑙𝑒
(A-33)
𝑘=𝑐𝑜𝑚𝑝𝑜𝑛𝑒𝑛𝑡𝑠 𝑖𝑛
𝑑𝑖𝑠𝑡𝑖𝑙𝑙𝑎𝑡𝑒 𝑠𝑡𝑟𝑒𝑎𝑚
𝑘
𝑘
𝑓𝑝𝑟𝑜𝑑𝑢𝑐𝑡
= 𝜁 𝑘 𝑓𝑓𝑒𝑒𝑑
𝑘
𝑘
𝑓𝑏𝑜𝑡𝑡𝑜𝑚
= (1 − 𝜁 𝑘 )𝑓𝑓𝑒𝑒𝑑
(A-34)
(A-35)
where Δ𝐻𝑐𝑜𝑛𝑑. is the enthalpy change to condense the distillate product (kJ/mol), 𝑅̅ is the
reflux ratio, 𝐻𝑘𝑉 is the heat of vaporization at given temperature (kJ/mol), 𝐶𝑃̅ 𝑘 is the specific
heat capacity of the distillate component (kJ/(mol · K)), Δ𝑇𝑠𝑒𝑛𝑠𝑖𝑏𝑙𝑒 is difference of boiling
point of distillate product and feed temperature (K) and 𝜁 is the split fraction of component
in each stream.
Table 7 Operational condition for each separation column
Separation Column
MEOH
DME
GSP
WSP
TSA
COPure
Operational condition
P=3.4 bar, T=318 K
𝜁 𝑚𝑒𝑡ℎ𝑎𝑛𝑜𝑙 = 99.9, R=1.5
P=11.2 bar, T=318 K
𝜁 𝑚𝑒𝑡ℎ𝑎𝑛𝑜𝑙 = 1, R=20
P=11.2 bar, T=318 K
𝜁𝑔𝑎𝑠𝑒𝑠 = 1
P=20 bar, T=383 K
𝜻𝒘𝒂𝒕𝒆𝒓 = 𝟏
P=1 bar,T=273-573K
𝜁 𝐶𝑂 = 0.99
Low P,T
𝜁 𝐶𝑂 = 0.98
Mixer and Splitter units
For mixers and splitter units, linear mass balance is considered for input(s) and output(s)
𝑘
𝑘
𝑓𝑚𝑖𝑥𝑒𝑟
= ∑ 𝑓𝑖𝑛,𝜄
𝜄
(A-36)
𝑘
𝑓𝑠𝑝𝑙𝑖𝑡𝑡𝑒𝑟,𝜄
= 𝜁𝜄 𝑓𝑖𝑛𝑘
(A-37)
where 𝜄 is the number of streams, k is the components and 𝜁 is the specified fraction for
each output stream.
Enthalpy analysis
For all considered units in polygeneration system and carbon capturing and sequestration,
the difference between input and output enthalpies is calculated by
𝑇2
𝑇3
𝑇4
𝐵5𝑘
(A-38)
𝐻𝑘 − 𝐻𝑘,298 = 𝐵1𝑘 𝑇 + 𝐵2𝑘 ( ) + 𝐵3𝑘 ( ) + 𝐵4𝑘 ( ) − (
)
2
3
4
𝑇
+ 𝐵6𝑘 − 𝐵7𝑘
where 𝑇 is temperature in 10−3 K, 𝐻𝑘 is the standard enthalpy in kJ/mol, and 𝐵𝑘 are the
parameters obtained from NIST Chemistry Web book. The energy efficiency of heat
exchangers is assumed to be 0.7.
Table 8 Coefficients in enthalpy estimation
k
CO
CO2
H2
O2
O2
N2
N2
CH4
H2O
B1
25.56
24.99
33.066
31.32
30.032
28.98
19.505
-0.703
30.092
B2
6.096
55.19
-11.363
-20.23
8.77
1.854
19.887
108.477
6.8323
B3
4.05
-33.69
11.43
57.86
-3.988
-9.647
-8.598
-42.521
6.7934
B4
-2.67
7.95
-2.77
-36.50
0.788
16.635
1.369
5.862
-2.5344
B5
0.131
-0.14
-0.158
-0.0073
-0.741
0.00012
0.527
0.678
0.0843
B6
-118.00
-403.61
-9.98
-8.903
-11.324
-8.672
-4.935
-76.843
-250.88
B7
-110.52
-393.52
0
0
0
0
0
-74.873
-241.82
T
298-1200
298-1200
298-1000
100-700
700-2000
100-500
500-2000
298-1300
500-1700
Objective Function
The net present value (NPV) of the project is estimated by
𝑁𝑃𝑉 = − (1 −
𝐶𝐼 = 𝐶𝐼 𝑏𝑎𝑠𝑖𝑐 (
𝜆 1
1
1
1
∙ ∙ (1 −
)) 𝐶𝐼 + ∙ (1 −
) 𝑁𝑃
𝜃
𝑑𝑝
𝜃𝑑𝑝 𝛿
𝛿
(1 + 𝛿)
(1 + 𝛿)𝜃𝑙𝑝
𝑓
𝑓 𝑏𝑎𝑠𝑖𝑐
)
𝑁𝑃 = 𝐶𝑜𝑠𝑡𝑓𝑒𝑒𝑑𝑠𝑡𝑜𝑐𝑘 − 𝑃𝑟𝑖𝑐𝑒𝑝𝑟𝑜𝑑𝑢𝑐𝑡𝑠 + 𝐶𝑜𝑠𝑡𝑒𝑚𝑖𝑠𝑠𝑖𝑜𝑛 𝑎𝑛𝑑 𝑠𝑒𝑞𝑢𝑒𝑠𝑡𝑟𝑎𝑡𝑖𝑜𝑛
(A-39)
(A-40)
(A-41)
where 𝐶𝐼 is the total Capital Investment cost of equipment for gasification, carbon capturing
and sequestration and methanol units, which are expressed by a linear approximation with
fixed cost charge of the Guthrie’s Modular Method with cost update factor for 2010, and NP
is the annual Net Profit of the integrated system, 𝜆 = 40% is tax rate, 𝜃𝑑𝑝 = 30 and 𝜃𝑙𝑝 =
10 years life and depreciation time of project and 𝛿 = 12% is the annual discount rate.
