Famous beaks Reading guide
advertisement
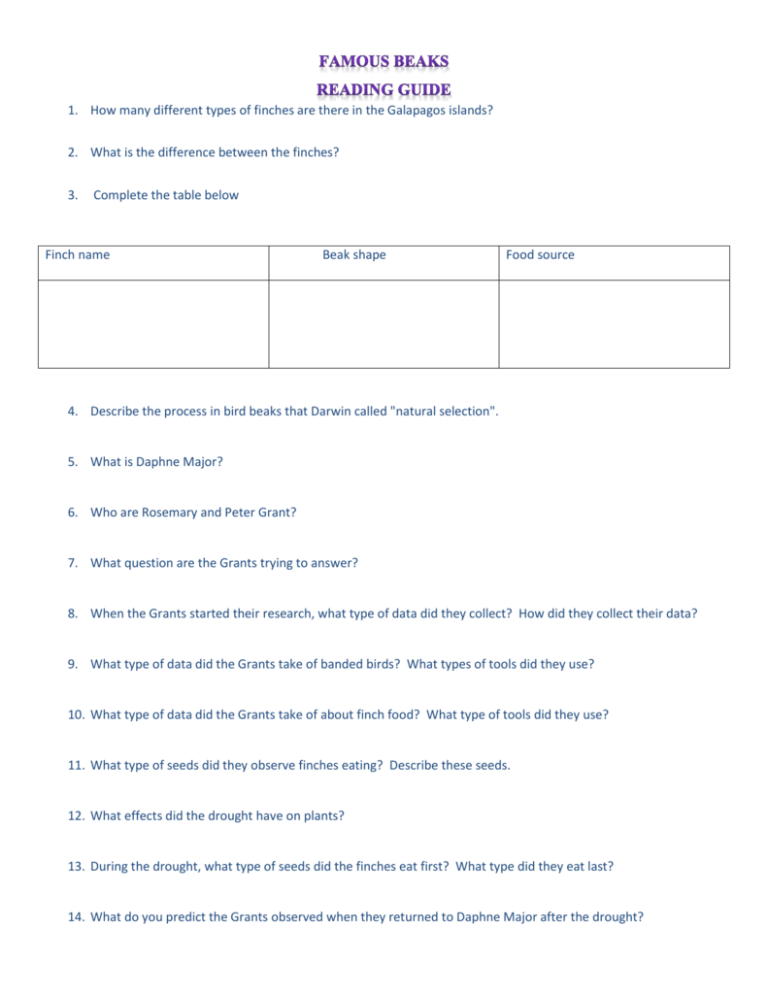
1. How many different types of finches are there in the Galapagos islands? 2. What is the difference between the finches? 3. Complete the table below Finch name Beak shape Food source 4. Describe the process in bird beaks that Darwin called "natural selection". 5. What is Daphne Major? 6. Who are Rosemary and Peter Grant? 7. What question are the Grants trying to answer? 8. When the Grants started their research, what type of data did they collect? How did they collect their data? 9. What type of data did the Grants take of banded birds? What types of tools did they use? 10. What type of data did the Grants take of about finch food? What type of tools did they use? 11. What type of seeds did they observe finches eating? Describe these seeds. 12. What effects did the drought have on plants? 13. During the drought, what type of seeds did the finches eat first? What type did they eat last? 14. What do you predict the Grants observed when they returned to Daphne Major after the drought? The finch beaks you measured were enlarged 10 times. The actual range of beak variation measured by the Grants is in millimeters, not centimeters. We enlarged the finch pictures so the differences would be more visible to you. Now you need to multiply by 10 (this shows them in millimeters). Calculate the beak sizes for the model and the actual birds in millimeters and insert them in the chart below. GROUND FINCH BAND NUMBER BEAK DEPTH IN CENTIMETERS BEAK DEPTH IN MILLIMETERS (cm x 10) Actual bird beak depth MILLEMETERS (Model depth mm/10) Finch 1075 Finch 2666 Finch 5560 Finch 3527 Finch 5026 Finch 1999 1. How many different beak sizes did you find? 2. What was the size in millimeters of the largest beak that you measured? 3. What was the size in millimeters of the smallest beak that you measured? 4. What is the difference in millimeters between the size of the largest and the smallest beaks that you measured? 5. Do you think that tiny variations in beak size matter for survival? Why or why not? Support your reasoning with evidence from your reading. 6. How is the paper model a good model for simulating the Grant’s research? 7. What are the limitations of using a paper model to simulate the Grant’s research? Battle of the Beaks: Normal Year Chart 1.Complete Test 1 and Test 2 for the small and large beak sizes for a normal year. Add up the totals and record them on the Battle of the Beaks: Normal Year Chart. Beak Type Small Beak Name of tester: Large Beak Name of tester: Normal Year (A mix of seeds) Test #1 Test # 2 Total Test #1 Test # 2 Total 2. Which beak size gathered the most seeds? 3. Complete Test 3 and Test 4 for the small and large beak sizes for a drought year. Add up the totals and record them on the Battle of the Beaks: Drought Year Chart. Beak Type Small Beak Name of tester: Large Beak Name of tester: Drought Year (Mostly big tough seeds) Test #3 Test # 4 Total Test #3 Test # 4 Total 4. Which beak size gathered the most seeds in a drought year? 5. Which beak size gathered the most seeds in a normal year? 6. Which beak size gathered the most seeds in a drought year? 7. Review your prediction under 3b (page 137) (Beak Testing: A Normal Year). Was your prediction correct or not? 8. How does a change in environment (drought) affect which beak size gathers the most seeds? 9. “Natural selection” occurs when the environment favors or selects some variations over others. You have tested two variations of beaks, large and small. In the drought environment, which beak is the best adaptation? Use evidence to support your statement? 10. Without variation in the beak size of the finch population survival is more limited. Explain how variation leads to successful adaptations to a changing climate. 1. Using the entries from the field notes, enter the data as a dot on the graph for each date. Connect the dots to complete the graph. 2. Review the Seed Abundance Graph. During what month and year did the seed supply shrink to its lowest amount? 3. During what month and year was the seed supply most abundant? 4. Using the entries from the field notes, enter the data as a dot on the graph for each date. Connect the dots to complete the graph. 5. Review the Finch Population Graph. When was the finch population the lowest? 6. When was the finch population the highest? Think About Seeds and Finches Together Compare the graphs side by side. 7. What happened to the finch population when the seed supply shrank to its lowest amount? How would you explain this? 8. When the seed supply increased, what was the effect on the finch population? How would you explain this? Bigger Beaks, But Why? 9. When the team returned to Daphne Major, they found only one in seven finches survived the drought. When they measured the survivors, they found that most were finches with big beaks. Why do you think bigger-beaked birds survived better than the smaller-beaked birds? Use evidence from the reading and activities to support your claim. Claim: Evidence: Consider This Beak size is a variation that is passed from parents to offspring. The scientists measured the baby finch beaks in 1979. What size beak do you predict most of the babies would have? What is your scientific reasoning? Be a science reporter Using the available data, graphs, articles on the lab stations and this activity: Write a news story about Natural Selection of medium ground finches on the island of Daphne Major. Tell your readers about how the finch populations have changed during the last 60 years as a result of environmental conditions. Describe the causes and the scientific explanation for these changes Cite your sources for each piece of evidence. Don’t forget the headline.
