Word - Delaware Department of Education
advertisement
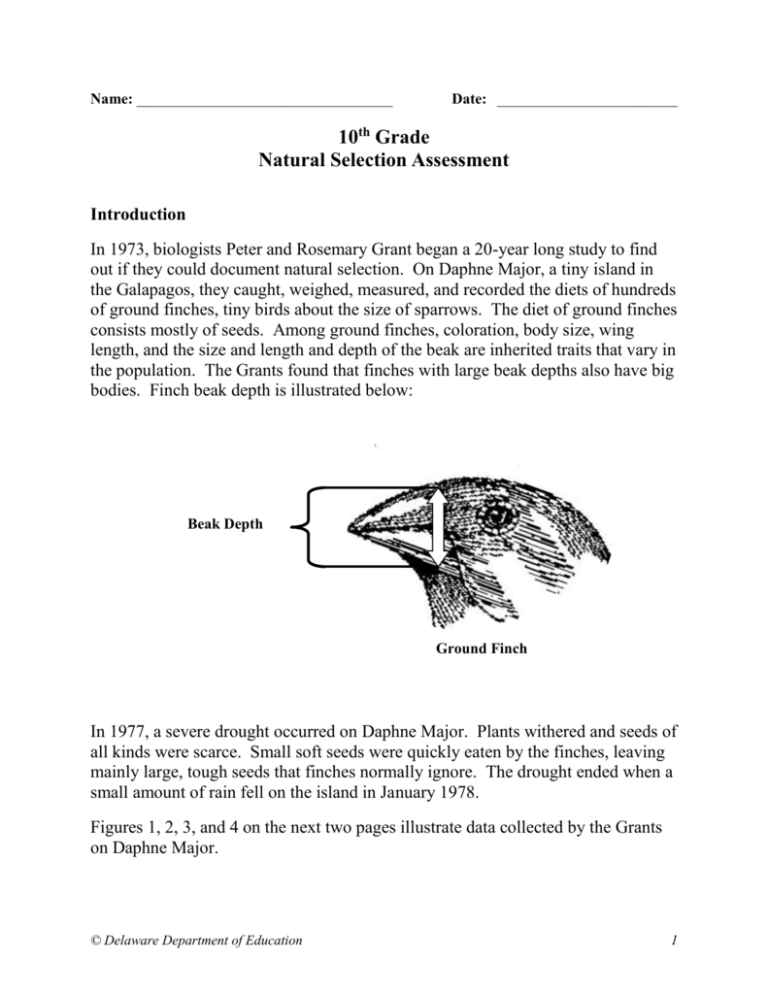
Name: __________________________________ Date: ________________________ 10th Grade Natural Selection Assessment Introduction In 1973, biologists Peter and Rosemary Grant began a 20-year long study to find out if they could document natural selection. On Daphne Major, a tiny island in the Galapagos, they caught, weighed, measured, and recorded the diets of hundreds of ground finches, tiny birds about the size of sparrows. The diet of ground finches consists mostly of seeds. Among ground finches, coloration, body size, wing length, and the size and length and depth of the beak are inherited traits that vary in the population. The Grants found that finches with large beak depths also have big bodies. Finch beak depth is illustrated below: Beak Depth Ground Finch In 1977, a severe drought occurred on Daphne Major. Plants withered and seeds of all kinds were scarce. Small soft seeds were quickly eaten by the finches, leaving mainly large, tough seeds that finches normally ignore. The drought ended when a small amount of rain fell on the island in January 1978. Figures 1, 2, 3, and 4 on the next two pages illustrate data collected by the Grants on Daphne Major. © Delaware Department of Education 1 1976 Finch Population Beak Depth (Total Number in Sample = 751) 80 70 Number of Finches 60 50 40 30 20 10 0 5.8 6.2 6.6 7 7.4 7.8 8.2 8.6 9 9.4 9.8 10.2 10.6 11 11.4 11.8 12.2 12.6 13 13.4 13.8 Beak Depth (mm) Figure 1 = mean beak depth 1978 Finch Population Beak Depth (Total Number in Sample = 89) 80 70 Number of Finches 60 50 40 30 20 10 0 5.8 6.2 6.6 7 7.4 7.8 8.2 8.6 9 9.4 9.8 10.2 10.6 11 11.4 11.8 12.2 12.6 13 13.4 13.8 Beak Depth (mm) = mean beak depth © Delaware Department of Education Figure 2 2 Changes in Finch Population Before and After the Drought of 1977 1600 Population Size 1400 1200 1000 800 600 400 200 0 Jan 0 1976 July 6 1976 Jan 12 1977 Jul 18 1977 Jan 24 1978 Jul 30 1978 Jan 36 1979 Figure 3 Changes in Seed Abundance Before and After the Drought of 1977 Seed Abundance (g/m 2) 12 10 8 6 4 2 0 Jan 0 1976 Jul 6 1976 Jan 12 1977 Jul 18 1977 Jan 24 1978 Jul 30 1978 Jan 36 1979 Figure 4 © Delaware Department of Education 3 Use Information in the Introduction and Figures 1-4 in answering the following questions: 1. What do the data in Figure 1 indicate about the range in beak depth in the finch population in 1976? (Note: Use numerical data in your response.) 2. How does mean beak depth before the drought (Figure 1) compare with mean beak depth after the drought (Figure 2)? (Note: Use numerical data in your response.) 3. Compare the size of the finch population in 1976 with the population in 1978 using information in Figure 3. (Note: Use numerical data in your response.) 4. What do the data in Figure 4 show about seed abundance before the drought compared with seed abundance after the drought? (Note: Use numerical data in your response.) 5. Describe the relationship between the abundance of seeds (Figure 4) and the size of the finch population (Figure 3). © Delaware Department of Education 4 6. Propose an explanation that accounts for the change in the mean depth of the finches’ beaks between 1976 and 1978 using your knowledge of natural selection and the information in the Introduction and Figures 1–4. © Delaware Department of Education 5 7. Little rain fell on Daphne Major from 1979 through 1982. At the beginning of 1983 unusually heavy rainfall occurred on the island. Plants that produced small seeds flourished while big-seed plant populations crashed. With plenty of food available, the size of the finch population increased dramatically over the next several years. a. Predict how the rainy weather of 1983 affected mean (average) beak depth over the next several generations using your knowledge of natural selection. Make your prediction by circling one of the following choices: A. Mean (average) beak depth increased. B. Mean (average) beak depth decreased. C. Mean (average) beak depth remained the same. b. Explain your prediction. © Delaware Department of Education 6
