File - BHS Physics
advertisement
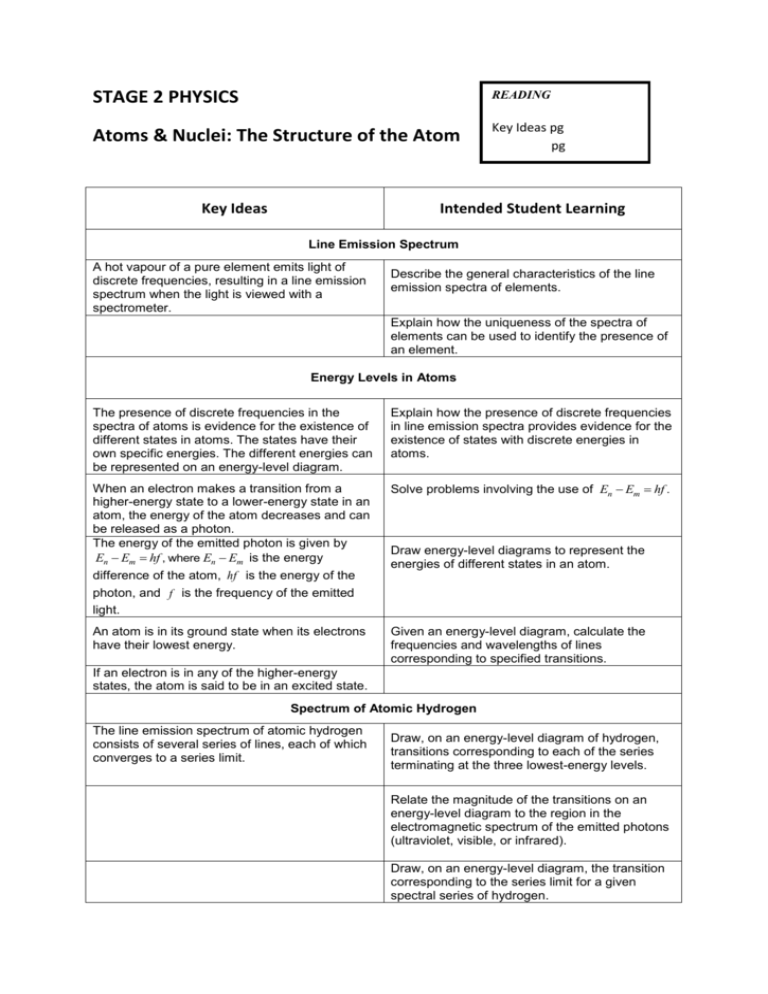
STAGE 2 PHYSICS READING Atoms & Nuclei: The Structure of the Atom Key Ideas pg pg Key Ideas Intended Student Learning Line Emission Spectrum A hot vapour of a pure element emits light of discrete frequencies, resulting in a line emission spectrum when the light is viewed with a spectrometer. Describe the general characteristics of the line emission spectra of elements. Explain how the uniqueness of the spectra of elements can be used to identify the presence of an element. Energy Levels in Atoms The presence of discrete frequencies in the spectra of atoms is evidence for the existence of different states in atoms. The states have their own specific energies. The different energies can be represented on an energy-level diagram. Explain how the presence of discrete frequencies in line emission spectra provides evidence for the existence of states with discrete energies in atoms. When an electron makes a transition from a higher-energy state to a lower-energy state in an atom, the energy of the atom decreases and can be released as a photon. The energy of the emitted photon is given by En Em hf , where En Em is the energy Solve problems involving the use of En Em hf . Draw energy-level diagrams to represent the energies of different states in an atom. difference of the atom, hf is the energy of the photon, and f is the frequency of the emitted light. An atom is in its ground state when its electrons have their lowest energy. Given an energy-level diagram, calculate the frequencies and wavelengths of lines corresponding to specified transitions. If an electron is in any of the higher-energy states, the atom is said to be in an excited state. Spectrum of Atomic Hydrogen The line emission spectrum of atomic hydrogen consists of several series of lines, each of which converges to a series limit. Draw, on an energy-level diagram of hydrogen, transitions corresponding to each of the series terminating at the three lowest-energy levels. Relate the magnitude of the transitions on an energy-level diagram to the region in the electromagnetic spectrum of the emitted photons (ultraviolet, visible, or infrared). Draw, on an energy-level diagram, the transition corresponding to the series limit for a given spectral series of hydrogen. The Structure of the Atom Atoms are made up of a dense, positively charged nucleus and negatively charged electrons that orbit in specific energy levels around the nucleus. The line emission spectrum of a specific element can be used to explain the unique way in which electrons are arranged around its nucleus. Particle Location Charge Line Emission Spectra When an element in gaseous or vapour form is excited (____________), it will emit light of _______________________________________ When this light is directed through a diffraction grating or spectrometer, it is split into its component colours. These colours make up a _____________________ that is unique to each element and so can be used to identify specific elements. The line emission spectrum will be made up of discrete lines, corresponding to individual frequencies on a black background. There may be lines present in the visible, infrared and ultraviolet regions of the electromagnetic spectrum. Lyman region ____________________ range of wavelengths ___________________ Balmer region _____________________ range of wavelengths ___________________ Paschen region _____________________ range of wavelengths ___________________ The line emission spectra of elements allow us to understand how electrons are arranged within the atoms of those elements (electronic structure). Our model for this electronic structure must be able to explain why distinct frequencies of light are present in the spectra of each element. Energy Levels in Atoms In atoms, electrons are found orbiting the nucleus in specific stable orbits. These orbits correspond to discrete energy levels within the atom. Electrons in higher orbits (ie _______________________) will have more energy than electrons in lower orbits. Electrons will try to occupy the lowest energy that they can as this will be their most stable state. Electrons can, however, move to higher energy levels if they are given more energy. It has been observed that electrons will only move from lower energy levels to higher energy levels by absorbing the ________________________________ corresponding to the energy difference between the two levels, Thus, the energy required to force an electron from a lower energy level to a higher energy level is given by E = Ehigher – Elower. However, if the energy supplied does not correspond directly to a particular energy gap, then the electron will _________________________. Electrons that are forced to higher energy levels in this way will rapidly fall back to lower, more stable positions. When this happens, an amount of energy corresponding to the energy difference between the levels is released as a photon. This photon will therefore have an energy given by Ehigher – Elower = E = h.f, where f is the frequency of the emitted photon. The above theory explains the discrete frequencies of light that are present in line emission spectra. Each frequency of the emitted light corresponds to a specific electron jump between different energy levels. Energy level diagrams are used to show the different energy levels for an electron and their corresponding energies. There are a number of new terms used in these diagrams: Ground state of an electron – ________________________________________________ ________________________________________________ Ground state of an atom – ________________________________________________ ________________________________________________ Ionisation energy – ______________________________________________________ ______________________________________________________ Transition – _____________________________________________________________ _____________________________________________________________ Excitation state – ______________________________________________________ ______________________________________________________ The Line Emission Spectrum of Atomic Hydrogen The line emission spectrum of hydrogen’s single electron can be divided into several series of lines. Each series has a maximum frequency in a different part of the electromagnetic spectrum. Remember that E = h.f and therefore the maximum frequency light wave of each series coincides to the greatest energy jump. This frequency is known as the series limit. Each series corresponds to a transition down to a specific energy level. In hydrogen, the three series that correspond to transitions down to the lowest three energy levels are given special names: Transitions down to the ground state are called the ______________________________. The photons emitted in this series have ______________________ frequencies, as their energies are higher than the other series. Transitions down to the second energy level are called the ___________________ Series. The photons emitted in this series have _________________ frequencies. Transitions down to the third energy level are called the _____________________ Series. The photons emitted in this series have ______________________ frequencies, as their energies are lower than the other series.

