Documentation of NJ average temperatures
advertisement
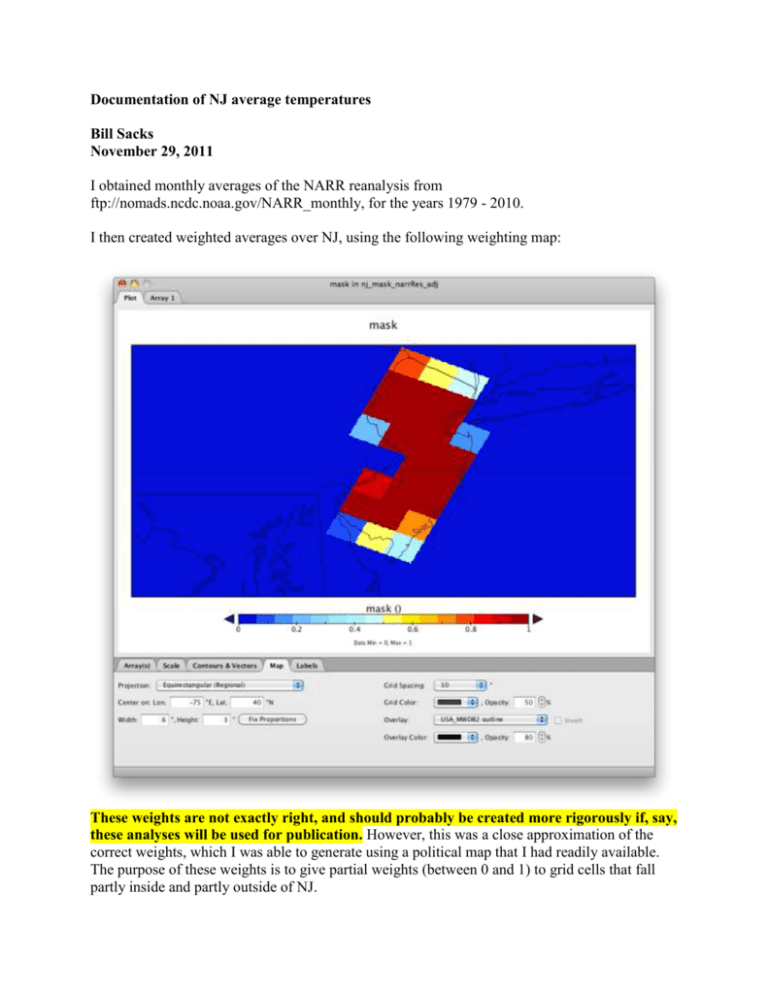
Documentation of NJ average temperatures Bill Sacks November 29, 2011 I obtained monthly averages of the NARR reanalysis from ftp://nomads.ncdc.noaa.gov/NARR_monthly, for the years 1979 - 2010. I then created weighted averages over NJ, using the following weighting map: These weights are not exactly right, and should probably be created more rigorously if, say, these analyses will be used for publication. However, this was a close approximation of the correct weights, which I was able to generate using a political map that I had readily available. The purpose of these weights is to give partial weights (between 0 and 1) to grid cells that fall partly inside and partly outside of NJ. I computed weighted averages of three temperature fields (here I give their names in the excel spreadsheet): temp_2m: Temperature 2m above the ground. This is probably the variable that corresponds most closely to direct temperature measurements, as would be reported by the state climatology office, for example. temp_lev1: Temperature of the lowest atmospheric level (this is probably somewhere around 30m above the ground, though I have not been able to determine this height definitively) temp_sfc: Temperature of the ground surface; I believe that this corresponds to the temperature of the soil / pavement / water / etc. (sometimes referred to as the "skin temperature"), though I have been unable to confirm that definitively For convenience, I also copied monthly data from the NJ state climatology office (http://climate.rutgers.edu/stateclim_v1/data/njhisttemp.html) into the same spreadsheet. I also report the difference between the 2m temperature field that I calculated from NARR and these data from the state climatology office. Here is a summary of the differences (in degrees C): Min. 1st Qu. Median Mean 3rd Qu. -1.7380 -0.6441 -0.2576 -0.2519 0.1036 Max. 5.2440 Positive values indicate higher temperatures in my analysis compared to the state climatology's office. The max value of 5.244 is a single outlier (Sept. 1992); removing this outlier, the max difference is 0.916 deg C. So, while there are some differences between the two sources, they are generally less than 1 - 2 degrees C.
