3. The Science of Light and Color 2014
Bio H – Energy
The Science of Light Energy and Color – Lab (if you open this online it is in color)
Energy comes in many different forms. Light is one form of energy that is particularly important to living things.
Without the light energy from the sun, life on earth would not exist.
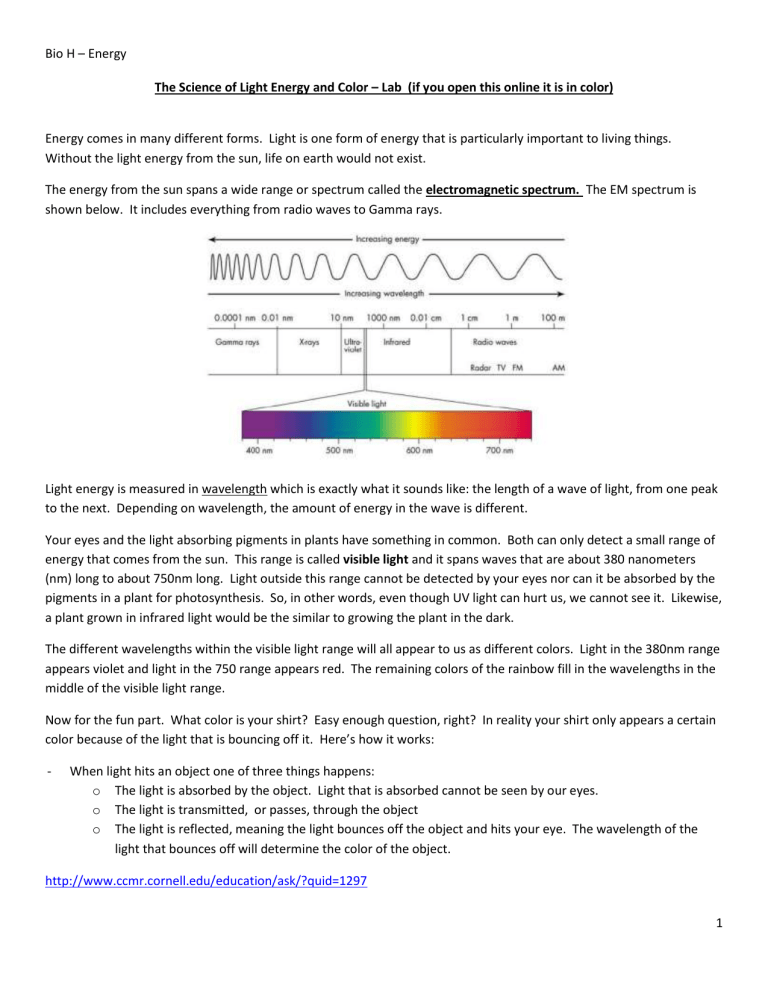
The energy from the sun spans a wide range or spectrum called the electromagnetic spectrum. The EM spectrum is shown below. It includes everything from radio waves to Gamma rays.
Light energy is measured in wavelength which is exactly what it sounds like: the length of a wave of light, from one peak to the next. Depending on wavelength, the amount of energy in the wave is different.
Your eyes and the light absorbing pigments in plants have something in common. Both can only detect a small range of energy that comes from the sun. This range is called visible light and it spans waves that are about 380 nanometers
(nm) long to about 750nm long. Light outside this range cannot be detected by your eyes nor can it be absorbed by the pigments in a plant for photosynthesis. So, in other words, even though UV light can hurt us, we cannot see it. Likewise, a plant grown in infrared light would be the similar to growing the plant in the dark.
The different wavelengths within the visible light range will all appear to us as different colors. Light in the 380nm range appears violet and light in the 750 range appears red. The remaining colors of the rainbow fill in the wavelengths in the middle of the visible light range.
Now for the fun part. What color is your shirt? Easy enough question, right? In reality your shirt only appears a certain color because of the light that is bouncing off it. Here’s how it works:
When light hits an object one of three things happens: o The light is absorbed by the object. Light that is absorbed cannot be seen by our eyes. o The light is transmitted, or passes, through the object o The light is reflected, meaning the light bounces off the object and hits your eye. The wavelength of the light that bounces off will determine the color of the object. http://www.ccmr.cornell.edu/education/ask/?quid=1297
1
Bio H – Energy http://www2.mcdaniel.edu/Biology/botf99/photo/l2inature.htm
Different wavelengths of light can combine to form different colors. A light that emits (gives off) wavelengths of 400nm
(blue) and 600nm (yellow) will look green because the two lights mix together. The sun emits all wavelengths in the visible light spectrum. They all combine together and look white. But REALLY they are many different colors of light together. If the sun’s light shines through a prism or a raindrop, each wavelength is bent at a slight different angle, separating them all out so we can see them individually. This is what makes a rainbow! You will use a device called a spectrometer that will act like a prism and show you all the wavelengths that are REALLY present in the light source.
So back to that shirt. Since you are sitting in a room with white light, your shirt is being hit with all colors of the rainbow.
Depending on the material and dyes used to make your shirt, some light might be reflected. This is what we are seeing.
Finally, the light being emitted can be measured and an intensity graph can be made. An intensity graph shows what wavelengths of light are present AND how intense each is. Intensity of light determines how bright it appears to our eyes. Look at the graph below.
Notice we have a peak that ranges from about 525nm to about 600nm.
The wavelengths in this range are present. The lack of peaks everywhere else indicates that those wavelengths are not present.
Now, imagine if this light ALSO had some light in the 450-460 nm range
BUT it wasn’t as bright as the light in the 525 – 600nm range. How would the 450nm-460nm peak differ in both height and width?
2
Bio H – Energy
Procedure: Look at each type of light through the spectroscope and draw the bands underneath the correct place on the scale using a colored pencil of the right color. Some light patterns will look like continuous changing colors, while
others will show discrete bands of light. LOOK AT SUNLIGHT FIRST!!!! (its on the next page) Be sure to draw your bands the approximate width AND intensity (brightness) that you see them. Use the scale inside the spectroscope to help you measure. The numbers on the scale represent wavelengths (5 =500, etc). . Then try to draw the intensity graph (graph to the right). Use a different color for the two types of light that you are comparing on each graph. Don’t forget about the relative intensity! So if one band looks brighter than the other, it should have a taller peak. If ALL the bands of one light look brighter ALL the peaks of that light should be taller.
Each graph (to the right) should contain 2 intensity graphs. ALL GRAPHS should be to the SAME scale. You will need to turn in your graphs and your discussion questions, so please be sure they are neat. I have included an extra “rough copy page” for the light graphs and bands
Examples of a color bar chart (on top) and an intensity graphs
Star: This diagram shows how the spectrum of neon would appear in the spectrum of a star. Here, the background
"rainbow" comes from the star (white light has a continuous spectrum), and the neon atoms in the star's atmosphere (or outer layers) absorb the stars light, leaving dark lines. Dark lines on a colored background are graphed as “dips” rather than peaks (you don’t have any dips in this activity. Note how the graph shows dips at each line position, producing the characteristic pattern of lines expected from neon.
Neon light:
This graphic demonstrates the optical spectrum one would see from glowing neon gas, both in colorbar and graphical formats. Neon shows a specific set of spectral lines. Note how each bright colored line in the color bar corresponds to one or more upward spikes. You will draw on “spike” or peak for each band or bar that you see. Wide “color bars” have wider peaks (at the base). Bright color bars have higher peaks, sharp spectral lines, like those in neon should have narrow peaks. You must be viewing this in color for it to make sense!
3
Bio H – Energy
(this is your rough draft) – you should “sketch the color areas, then go back on your own time and “fill them in nicely on the next page.
Compact Fluorescent Bulb:
LED Flashlight
Black light bulb:
Glow Stick: ________________ (what color ?)
Sun (if it is out, use the light reflection off white paper)
“Daylight” incandescent bulb:
4
Bio H – Energy
Compact Fluorescent Bulb:
LED Flashlight
Black light bulb:
Glow Stick: ________________ (what color?)
Sun (if it is out, use the light reflection off white paper)
“Daylight” incandescent bulb:
5
Bio H – Energy
Discussion Questions (READ THE LINK S BELOW CAREFULLY) : http://www.chemistryland.com/CHM107Lab/Exp7/Spectroscope/Spectroscope.html
http://csep10.phys.utk.edu/astr162/lect/light/spectrum.html
(look at wavelength (cm) and energy (eV) and the picture on the first page of your lab. http://www2.mcdaniel.edu/Biology/botf99/photo/l2inature.htm
1.
What is the relationship between the wavelength of light and the amount of energy it has?
2.
Why is it that biologists are particularly interested in the range of light from 380 – 750nm? Provide 2 reasons.
3.
Pigments are molecules that absorb light energy. Plants are filled with a pigment called chlorophyll which we know is green. a.
What color light is reflected by the chloroplasts? b.
What colors can be absorbed? c.
Which of the above is used to build glucose during photosynthesis?
4.
You are walking down the sidewalk in bare feet during a sunny summer day. The light colored concrete is warm, but tolerable. You get to an intersection and step into the black asphalt street. Immediately you start hopping around like a cartoon character as smoke rises from your burning feet. Why was the asphalt so much hotter than the concrete when both were in the sun?
5.
Examine the spectrum from each type of light that was looked at in the lab. Rank them in the order that you think they would benefit a plant. Start with the LEAST beneficial and end with the MOST beneficial. In a sentence or two, explain your ranking.
6
Bio H – Energy
6.
A similar graph can be made for pigments BUT instead of showing the light energy being emitted (pigments are not lights!) they show what wavelengths of light and how much of each a pigment can absorb. Below is a graph showing the percentage absorption of different wavelengths by chlorophyll a. (they were bad and didn’t label their Y axis but it should say “% absorbed”)
If we only had single color bulbs to grow our plants, what color would we want it to be and why?
Which color bulb would basically be like growing the plant in the dark? Why?
7
