Tables
advertisement
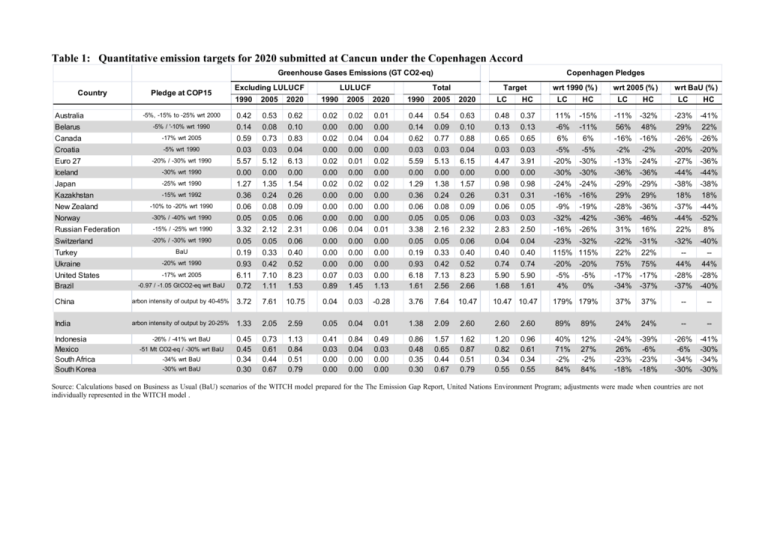
Table 1: Quantitative emission targets for 2020 submitted at Cancun under the Copenhagen Accord Greenhouse Gases Emissions (GT CO2-eq) Country Pledge at COP15 Australia Belarus Canada -5%, -15% to -25% wrt 2000 -5% / '-10% wrt 1990 -17% wrt 2005 Croatia Euro 27 Iceland Japan Kazakhstan New Zealand Norway Russian Federation Switzerland Turkey Ukraine United States Brazil -5% wrt 1990 -20% / -30% wrt 1990 -30% wrt 1990 -25% wrt 1990 -15% wrt 1992 -10% to -20% wrt 1990 -30% / -40% wrt 1990 -15% / -25% wrt 1990 -20% / -30% wrt 1990 BaU -20% wrt 1990 -17% wrt 2005 -0.97 / -1.05 GtCO2-eq wrt BaU Excluding LULUCF LULUCF Copenhagen Pledges Total Target wrt 1990 (% ) wrt 2005 (% ) wrt BaU (% ) 1990 2005 2020 1990 2005 2020 1990 2005 2020 LC HC LC HC LC HC LC HC 0.42 0.14 0.59 0.53 0.08 0.73 0.62 0.10 0.83 0.02 0.00 0.02 0.02 0.00 0.04 0.01 0.00 0.04 0.44 0.14 0.62 0.54 0.09 0.77 0.63 0.10 0.88 0.48 0.13 0.65 0.37 0.13 0.65 11% -6% 6% -15% -11% 6% -11% 56% -16% -32% 48% -16% -23% 29% -26% -41% 22% -26% 0.03 5.57 0.00 1.27 0.36 0.06 0.05 3.32 0.05 0.19 0.03 5.12 0.00 1.35 0.24 0.08 0.05 2.12 0.05 0.33 0.04 6.13 0.00 1.54 0.26 0.09 0.06 2.31 0.06 0.40 0.00 0.02 0.00 0.02 0.00 0.00 0.00 0.06 0.00 0.00 0.00 0.01 0.00 0.02 0.00 0.00 0.00 0.04 0.00 0.00 0.00 0.02 0.00 0.02 0.00 0.00 0.00 0.01 0.00 0.00 0.03 5.59 0.00 1.29 0.36 0.06 0.05 3.38 0.05 0.19 0.03 5.13 0.00 1.38 0.24 0.08 0.05 2.16 0.05 0.33 0.04 6.15 0.00 1.57 0.26 0.09 0.06 2.32 0.06 0.40 0.03 4.47 0.00 0.98 0.31 0.06 0.03 2.83 0.04 0.40 0.03 3.91 0.00 0.98 0.31 0.05 0.03 2.50 0.04 0.40 -5% -20% -30% -24% -16% -9% -32% -16% -23% 115% -5% -30% -30% -24% -16% -19% -42% -26% -32% 115% -2% -13% -36% -29% 29% -28% -36% 31% -22% 22% -2% -24% -36% -29% 29% -36% -46% 16% -31% 22% -20% -27% -44% -38% 18% -37% -44% 22% -32% -- -20% -36% -44% -38% 18% -44% -52% 8% -40% -- 0.93 6.11 0.72 0.42 7.10 1.11 0.52 8.23 1.53 0.00 0.07 0.89 0.00 0.03 1.45 0.00 0.00 1.13 0.93 6.18 1.61 0.42 7.13 2.56 0.52 8.23 2.66 0.74 5.90 1.68 0.74 5.90 1.61 -20% -5% 4% -20% -5% 0% 75% -17% -34% 75% -17% -37% 44% -28% -37% 44% -28% -40% 179% 179% 37% 37% -- -- China reduce carbon intensity of output by 40-45% wrt3.72 2005 7.61 10.75 0.04 0.03 -0.28 3.76 7.64 10.47 10.47 10.47 India reduce carbon intensity of output by 20-25% wrt1.33 2005 2.05 2.59 0.05 0.04 0.01 1.38 2.09 2.60 2.60 2.60 89% 89% 24% 24% -- -- 0.73 0.61 0.44 0.67 1.13 0.84 0.51 0.79 0.41 0.03 0.00 0.00 0.84 0.04 0.00 0.00 0.49 0.03 0.00 0.00 0.86 0.48 0.35 0.30 1.57 0.65 0.44 0.67 1.62 0.87 0.51 0.79 1.20 0.82 0.34 0.55 0.96 0.61 0.34 0.55 40% 71% -2% 84% 12% 27% -2% 84% -24% 26% -23% -18% -39% -6% -23% -18% -26% -6% -34% -30% -41% -30% -34% -30% Indonesia Mexico South Africa South Korea -26% / -41% wrt BaU -51 Mt CO2-eq / -30% wrt BaU -34% wrt BaU -30% wrt BaU 0.45 0.45 0.34 0.30 Source: Calculations based on Business as Usual (BaU) scenarios of the WITCH model prepared for the The Emission Gap Report, United Nations Environment Program; adjustments were made when countries are not individually represented in the WITCH model . Table 2: Target starting points for the 12 modeled regions (the case of 500 ppm goal) EU USA Australia, S.Africa & S.Korea Japan, Canada & NZ TE LAM India EASIA SASIA CHINA SSA MENA 2020 30% below 1990 emissions 17% below 2005 34% below baseline 30% below 2005 BAU BAU BAU BAU BAU BAU BAU BAU 2050 50% below 1990 83% below 2005 50% below baseline 65% below 2005 Cap based on formula in 2055 Cap based on formula in 2040 BAU (cap based on formula, from 2060) BAU (cap based on formula, from 2060) BAU Cap based on formula in 2050 BAU Cap based on formula in 2065 Table 3: Present discounted value of cost region by region (as percent of income) 3a: Measured relative to alternative baseline of no international policy (i.e., BAU criterion) USA EU 0.6% 0.2% KoSAu CaJaZ 0.7% 0.7% TE 1.2% MENA 2.2% SSA -0.1% SAsia -0.2% China 1.1% EAsia 0.1% LAm India 0.5% 0.4% 3b: Measured relative to the alternative of unilateral dropping out while others continue to cooperate (i.e., Nash criterion) USA EU KoSAu CaJaZ TE MENA SSA SAsia China EAsia LAm India 0.7% 0.3% 0.8% 0.6% 0.8% 0.8% -0.1% 0.1% 1.0% 0.4% 0.4% 0.7% Table A1: Estimation of Progressivity Cancun emission target cuts, expressed relative to BAU, regressed against income per capita (21 country observations, counting EU27 as one) Countries submitting negative cuts relative to BAU are: taken at face value Intercept γ set = 0 Intercept γ Coefficient estimate 0.018 -0.162 0.008 -0.130 Standard error 0.065 0.043 0.050 0.034 t-statistic 0.07 -3.72 0.16 -3.87 P value 0.789 0.001 0.878 0.001 R2 0.421 0.441 Table A2: Estimation of progressivity and latecomer catch-up factors Dependent variable: (lnTarget 2020 – lnBAU 2020 ) Coef. Std. Err. ln income per capita ln emissions2007 -lnBAU2020 ln emissions2007 - ln emissions1990 Constant term -0.156 0.376 -0.328 1.384 0.031 -5.07 0 0.100 3.76 0.002 0.091 -3.58 0.002 0.300 4.62 0 t P>t . df Number of observations Source SS F ( 3, 17) 13.02 Model 1.092 3 Prob > F 0.0001 Residual 0.475 17 R2 Adj Total 1.567 20 21 0.697 R2 0.643 Root MSE 0.167 [95% Conf. Interval] -0.22 0.16 -0.52 0.75 -0.09 0.59 -0.13 2.02
