jane12238-sup-0001-Suppinfo
advertisement
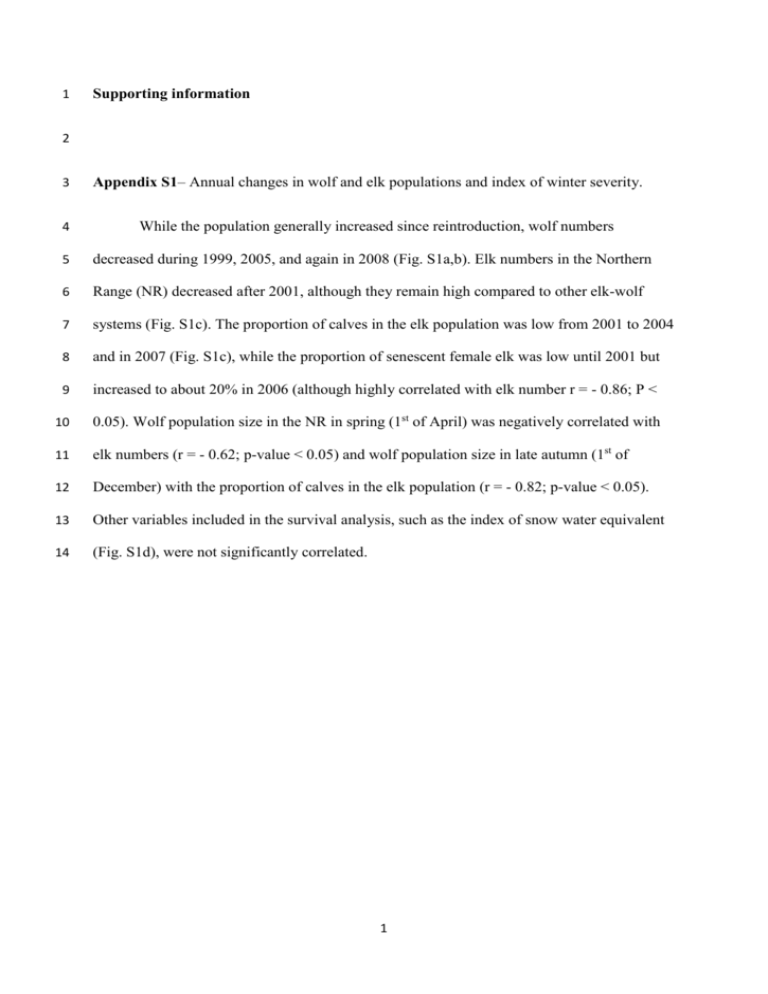
1 Supporting information 2 3 4 Appendix S1– Annual changes in wolf and elk populations and index of winter severity. While the population generally increased since reintroduction, wolf numbers 5 decreased during 1999, 2005, and again in 2008 (Fig. S1a,b). Elk numbers in the Northern 6 Range (NR) decreased after 2001, although they remain high compared to other elk-wolf 7 systems (Fig. S1c). The proportion of calves in the elk population was low from 2001 to 2004 8 and in 2007 (Fig. S1c), while the proportion of senescent female elk was low until 2001 but 9 increased to about 20% in 2006 (although highly correlated with elk number r = - 0.86; P < 10 0.05). Wolf population size in the NR in spring (1st of April) was negatively correlated with 11 elk numbers (r = - 0.62; p-value < 0.05) and wolf population size in late autumn (1st of 12 December) with the proportion of calves in the elk population (r = - 0.82; p-value < 0.05). 13 Other variables included in the survival analysis, such as the index of snow water equivalent 14 (Fig. S1d), were not significantly correlated. 1 a) b) 200 all YNP NR INT Number of wolves in December Number of wolves in April 200 150 100 50 0 all YNP NR INT 150 100 50 0 1998 2000 2002 2004 2006 2008 1998 2000 2002 Year 2004 2006 2008 2006 2008 Year c) d) elk count calves senescent 14000 0.5 1.5 0.4 1.0 0.5 0.3 SWE Elk count 12000 10000 0.0 0.2 -0.5 8000 0.1 6000 0.0 -1.0 -1.5 1998 15 2000 2002 2004 2006 2008 1998 Year 2000 2002 2004 Year 16 Fig. S1. Wolf population size in April (a), and in December (b) in the Northern Range (NR) 17 and the interior range (INT), and total population size in Yellowstone National Park (YNP) 18 from 1998 to 2009. Number of elk, number of calves per 100 cows (calves) and proportion of 19 senescent elk > 14 years-old (senescent) are presented in panel (c), and the index of winter 20 severity (SWE) is presented in panel (d) from 1998 to 2009. 21 22 Appendix S2– Cause-specific mortality data. 23 All radio-collars included a mortality switch that allowed us to determine the time, 24 and in some instances, cause of death (see Murray et al. 2010 for further details). Between 25 1998 and 2010, we determined cause of death for 155 wolves (not all of them were radio- 2 26 collared) that died inside YNP. Death was classified as human-induced (including incidents 27 with vehicles and four control actions), or natural-caused (intra- or interspecific conflicts, 28 malnutrition, disease, or unknown causes of natural mortality) or unknown causes. Table 1 29 summarises the average proportion of deaths attributed to each of these causes in the NR, in 30 the interior, and across YNP. 31 Because some causes of mortality can have a higher probability of being detected than 32 others, the annual proportion of mortality attributed to each factor is unlikely to be a good 33 index of the true incidence of these factors in the population. For example, human-caused 34 mortalities are detected with complete certainty, while the probability of detecting other 35 causes of mortality is not. This is why we analysed survival data obtained from the systematic 36 monitoring of radio-collared individuals, and used capture-recapture methods to obtained 37 unbiased estimates of survival rates, rather than analysing mortality data. 38 Nonetheless, cause-specific mortality data also suggested that density-dependent 39 intraspecific aggression was the main cause of mortality in the NR. The number of wolf- 40 caused mortalities increased with wolf density in the NR (Fig. S2a), and was highly and 41 positively correlated with the number of intraspecific aggressions (r = 0.70, p-value = 0.009; 42 Fig. S2b). 3 a) b) 8 No. wolf-caused mortatlities No. wolf-caused mortatlities 8 6 4 6 4 2 2 0 0 30 40 50 60 70 80 10 2 Density (wolves/1000km ) 20 30 40 No. aggressions 43 44 Fig. S2. Number of wolf-caused mortalities as a function of wolf density in April, expressed 45 in number of wolves per 1000 km2 (a), and as a function of the number of intraspecific 46 aggressive interactions (b) in the NR between 1995 and 2012. Observed values (black dots) 47 and predictions from the corresponding log-linear model (dash lone) are presented. 4

