Problem set #1
advertisement
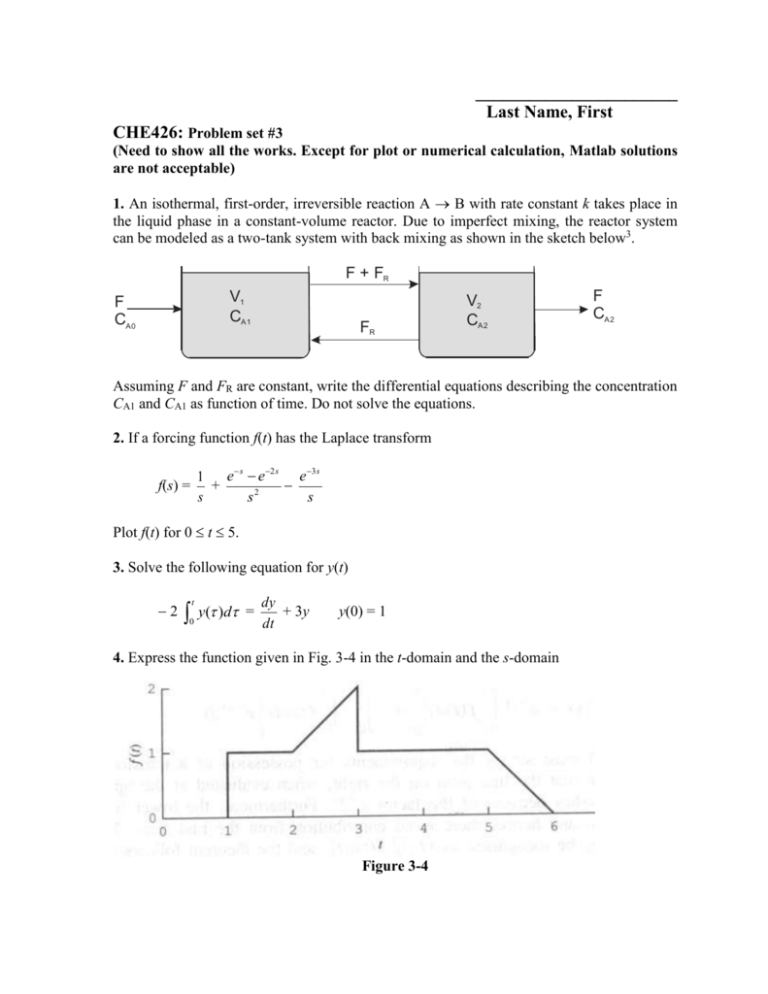
_______________________ Last Name, First CHE426: Problem set #3 (Need to show all the works. Except for plot or numerical calculation, Matlab solutions are not acceptable) 1. An isothermal, first-order, irreversible reaction A B with rate constant k takes place in the liquid phase in a constant-volume reactor. Due to imperfect mixing, the reactor system can be modeled as a two-tank system with back mixing as shown in the sketch below3. F + FR V1 CA1 F CA0 FR V2 CA2 F CA2 Assuming F and FR are constant, write the differential equations describing the concentration CA1 and CA1 as function of time. Do not solve the equations. 2. If a forcing function f(t) has the Laplace transform e s e 2 s e 3s 1 + s s2 s f(s) = Plot f(t) for 0 t 5. 3. Solve the following equation for y(t) 2 t 0 y( )d = dy + 3y dt y(0) = 1 4. Express the function given in Fig. 3-4 in the t-domain and the s-domain Figure 3-4 5. Sketch the following functions: a) f(t) = u(t) 2u(t 1) + u(t 3) b) f(t) = 3tu(t) 3u(t 1) u(t 2) 6. Determine f(t) at t = 1.5 and at t = 3 for the following function: f(t) = 0.5 u(t) − 0.5 u(t 1) + (t 3) u(t 2) 7. Find the solution to the following differential equations using Laplace Transforms. a) y′ + y = (t) , y(0) = 0 b) y′+ y = (t −1), y(0) = 0 8. For the following transforms, find lim f(t). t 1 s ( s 1) 2 1 (b) f(s) = s ( s 1) 2 (a) f(s) = 9. Develop the dynamic model equations for the continuous stirred tank (CST) thermal mixer shown in Figure 3.9. FC (F1)spe c FT F1 F2 T1 T2 TT T Figure 3.9 Schematic of a CST thermal mixing process. The process parameters and variables are defined as: F1: mass flow rate of stream 1 (initially 5 kg/s) F2: mass flow rate of stream 2 (5 kg/s) M: mass of liquid in the mixer (100 kg) = constant (perfect level control) T1: temperature of stream 1 (25oC) T2: temperature of stream 2 (75oC) t: time (s) v: the time constant for the flow controller on stream 1 (2 s) Ts: the time constant for the temperature sensor on the product stream (6 s), the dynamic model for the sensor is dTs 1 = (T Ts) dt Ts where T is the liquid temperature in the tank and Ts is the sensor temperature. At time equal to 10 seconds, a step change in the special flow rate for stream 1 is made from 5 kg/s to 4 kg/s. Plot the product stream temperature and the sensor temperature from 0 to 100 s. Use Matlab to plot and label the graph with your name using the Title command. Note: The solution to this problem is in reference (4). References 1. D.R. Coughanowr and S. LeBlanc, Process Systems Analysis and Control, McGraw-Hill, 3nd edition, 2008. 2. Mass Transfer by Hines and Maddox. 3. Process Modeling, Simulation, and Control for Chemical Engineers by Luyben. 4. Chemical and Bio-Process Control by James B. Riggs and M. Nazmul Karim
