do they vary for patients with heart and chronic kidney disease
advertisement

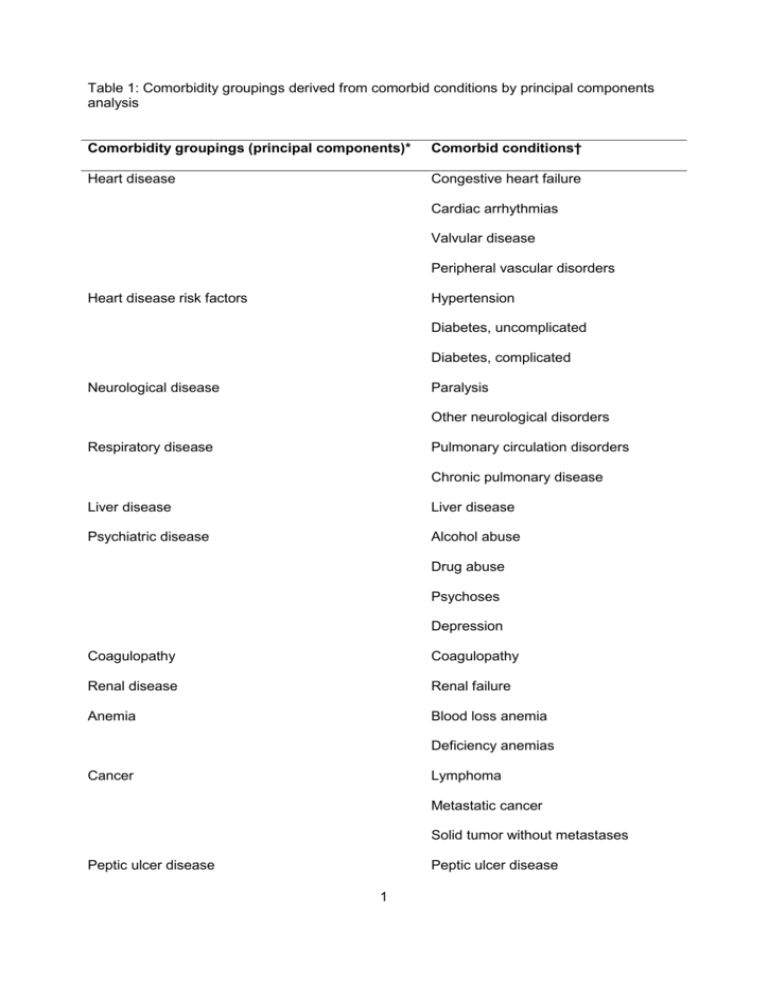
Table 1: Comorbidity groupings derived from comorbid conditions by principal components analysis Comorbidity groupings (principal components)* Comorbid conditions† Heart disease Congestive heart failure Cardiac arrhythmias Valvular disease Peripheral vascular disorders Heart disease risk factors Hypertension Diabetes, uncomplicated Diabetes, complicated Neurological disease Paralysis Other neurological disorders Respiratory disease Pulmonary circulation disorders Chronic pulmonary disease Liver disease Liver disease Psychiatric disease Alcohol abuse Drug abuse Psychoses Depression Coagulopathy Coagulopathy Renal disease Renal failure Anemia Blood loss anemia Deficiency anemias Cancer Lymphoma Metastatic cancer Solid tumor without metastases Peptic ulcer disease Peptic ulcer disease 1 Endocrine disease Hypothyroidism Rheumatological disease Rheumatoid arthritis/collagen vascular diseases * Principal components analysis initially derived 9 comorbidity groupings. Groupings having two or more clinically meaningful clusters of comorbid conditions were disaggregated so that their final count was 13. † The list of comorbid conditions comprised 26 out of 30 Elixhauser comorbidity measures (1). 2 Table 2: Characteristics of Veterans Affairs (VA) Intensive Care Unit (ICU) patients in the study population with complete information on selected laboratory tests (n=182,792) Explanatory variables All (n=182,792) Died in hospital Yes No (n=22,848) (n=159,944) 11.2 (2.6) 9.6 (2.3) 11.4 (2.6) 66.2 (12.5) 70.5 (11.8) 65.6 (12.5) 177,966 (97.4) 22,440 (98.2) 155,526 (97.2) White 116,335 (63.6) 14,055 (61.5) 102,280 (63.6) Black 30,660 (16.8) 3,898 (17.1) 26,762 (16.7) Others and unknown 35,797 (19.6) 4,895 (21.4) 30.902 (19.3) 134,121 (73.4) 11,479 (50.2) 122,642 (76.7) 4.9 (7.5) 8.4 (15.0) 4.4 (5.5) 43,013 (23.5) 6,638 (29.1) 36,375 (22.7) 1.8 (1.8) 2.3 (1.9) 1.7 (1.8) Mean blood urea nitrogen level, mg/dL (SD) 29.4 (24.9) 42.9 (31.3) 27.5 (23.3) Mean blood total white count, X109/L (SD) 10.5 (9.7) 14.3 (16.1) 10.0 (8.2) Mean serum albumin level, g/dL (SD) 3.5 (0.8) 2.8 (0.9) 3.6 (0.7) Mean hemoglobin level, g/dL (SD) Demographic features Mean age, years (SD) Male, n (%) Race, n (%) ICU admission-related features Direct admission, n (%) Mean ICU length of stay, days (SD) Chronic kidney disease, n (%) Laboratory tests Mean serum creatinine level, mg/dL (SD) 3 Comorbidity groupings, n (%) Heart disease, 45,689 (25.0) 8,045 (35.2) 37,644 (23.5) Heart disease risk factors 71,481 (39.1) 9,936 (43.5) 61,545 (38.5) Neurological disease 13,341 (7.3) 2,163 (9.5) 11,178 (7.0) Respiratory disease 38,307 (21.0) 6,097 (26.7) 32,210 (20.1) 9,426 (5.2) 1,709 (7.5) 7,717 (4.8) 37,798 (20.7) 4,535 (19.8) 33,263 (20.8) Coagulopathy 7,127 (3.9) 1,727 (7.6) 5,400 (3.4) Renal disease 12,902 (7.1) 2,427 (10.6) 10,475 (6.5) Anemia 28,223 (15.4) 4,830 (21.1) 23,393 (14.6) Cancer 19,430 (10.6) 4,070 (17.8) 15,360 (9.6) Peptic ulcer disease 4,350 (2.4) 617 (2.7) 3,733 (2.3) Endocrine disease 7,400 (4.0) 1,191 (5.2) 6,209 (3.9) Rheumatological disease 2,406 (1.3) 399 (1.7) 2,007 (1.3) Angina/unstable angina 4,602 (2.5) 48 (0.2) 4,554 (2.8) Congestive heart failure 10,712 (5.9) 1,141 (5.0) 9,571 (6.0) Arrhythmia 6,422 (3.5) 384 (1.7) 6,038 (3.8) Acute myocardial infarction 18,487 (10.1) 1,620 (7.1) 16,867 (10.5) Other cardiovascular diseases 23,592 (12.9) 960 (4.2) 22,632 (14.1) Peripheral vascular disease 739 (0.4) 126 (0.6) 613 (0.4) Valvular heart disease 723 (0.4) 72 (0.3) 651 (0.4) Gastrointestinal bleeding 9,975 (5.5) 761 (3.3) 9,214 (5.8) Other gastrointestinal disease 6,410 (3.5) 1,068 (4.7) 5,342 (3.3) Gastrointestinal neoplasm 1,198 (0.7) 330 (1.4) 868 (0.5) Serious neurological disease 6,263 (3.4) 1,204 (5.3) 5,059 (3.2) Liver disease Psychiatric disease ICU Admission Diagnoses, n (%) 4 Minor neurological disease 407 (0.2) 28 (0.1) 379 (0.2) 51,639 (28.2) 5,370 (23.5) 46,269 (28.9) Orthopedic, non-surgically treated 1,774 (1.0) 260 (1.1) 1,514 (0.9) Renal disease 4,842 (2.6) 865 (3.8) 3,977 (2.5) Lung neoplasm 1,402 (0.8) 582 (2.5) 820 (0.5) Respiratory arrest/failure 7,897 (4.3) 2,776 (12.1) 5,121 (3.2) Pneumonia 8,348 (4.6) 1,829 (8.0) 6,519 (4.1) Chronic obstructive pulmonary disease 6,232 (3.4) 646 (2.8) 5,586 (3.5) Other respiratory disease 3,082 (1.7) 497 (2.2) 2,585 (1.6) Infection 8,046 (4.4) 2,281 (10.0) 5,765 (3.6) 25,382 (13.9) 5,344 (23.4) 20,038 (12.5) Other medical diagnoses Blood transfusion during first 30 days of ICU admission, n (%) 5 Table 3: Logistic regression examining the relationship between blood transfusion and hospital mortality in Veterans Affairs ICU admissions from years 2001 to 2005 Explanatory variable Odds ratio (95% confidence interval) Without selected With selected blood blood test variables test variables (n=258,826) (n=182,792) 0.21 (0.18 to 0.25) 0.38 (0.32 to 0.46) Age (per 10 years) 1.38 (1.36 to 1.39) 1.32 (1.31 to 1.34) Male gender 1.45 (1.31 to 1.60) 1.27 (1.14 to 1.42) Black 0.98 (0.94 to 1.02) 0.99 (0.95 to 1.03) Others 1.27 (1.21 to 1.34) 1.30 (1.22 to 1.38) Unknown 1.13 (1.08 to 1.17) 1.09 (1.04 to 1.15) Direct Admission 0.50 (0.48 to 0.51) 0.60 (0.58 to 0.62) Length of ICU stay (per day) 1.02 (1.02 to 1.02) 1.02 (1.02 to 1.02) Hemoglobin (per g/dL) 0.79 (0.79 to 0.80) 0.87 (0.86 to 0.88) Chronic kidney disease 1.04 (1.01 to 1.07) 0.99 (0.84 to 0.92) Heart disease 1.09 (1.05 to 1.14) 1.13 (1.08 to 1.17) Heart disease risk factors 0.83 (0.80 to 0.85) 0.84 (0.80 to 0.87) Neurological disease 1.13 (1.07 to 1.19) 1.11 (1.04 to 1.17) Respiratory disease 1.07 (1.04 to 1.11) 1.11 (1.06 to 1.15) Liver disease 1.72 (1.62 to 1.82) 1.46 (1.36 to 1.57) Psychiatric disease 1.02 (0.98 to 1.06) 1.01 (0.97 to 1.05) Transfusion during first 30 days of ICU admission Race (Reference: White) Comorbidity Groupings 6 Coagulopathy 1.68 (1.58 to 1.79) 1.60 (1.49 to 1.68) Renal disease 1.15 (1.09 to 1.21) 0.95 (0.90 to 1.06) Anemia 0.91 (0.88 to 0.95) 0.94 (0.89 to 0.98) Peptic ulcer disease 1.03 (0.94 to 1.13) 1.05 (0.95 to 1.16) Cancer 1.42 (1.36 to 1.48) 1.39 (1.34 to 1.45) Endocrine disease 1.07 (1.01 to 1.14) 1.12 (1.04 to 1.20) Rheumatological disease 1.07 (0.96 to 1.20) 1.07 (0.95 to 1.21) ICU admission diagnoses (Reference: Other medical diseases) Angina/unstable angina 0.15 (0.12 to 0.20) 0.19 (0.14 to 0.27) Congestive heart failure 1.00 (0.93 to 1.07) 0.93 (0.86 to 1.01) Arrhythmia 0.57 (0.52 to 0.62) 0.63 (0.55 to 0.70) Acute myocardial infarction 0.97 (0.91 to 1.03) 1.04 (0.97 to 1.12) Other cardiovascular disease 0.91 (0.97 to 0.85) 0.63 (0.71 to 0.55) Peripheral vascular disease 1.06 (0.89 to 1.27) 1.06 (0.86 to 1.31) Valvular heart disease 0.70 (0.55 to 0.88) 0.81 (0.62 to 1.06) Gastrointestinal bleeding 0.40 (0.37 to 0.43) 0.46 (0.42 to 0.51) Other gastrointestinal disease 1.36 (1.27 to 1.46) 1.17 (1.08 to 1.26) Gastrointestinal neoplasm 2.10 (1.86 to 2.36) 1.90 (1.65 to 2.18) Serious neurological disease 2.48 (2.34 to 2.64) 2.64 (2.44 to 2.86) Minor neurological disease 0.68 (0.46 to 1.01) 0.95 (0.63 to 1.45) Orthopedic (medical) 0.81 (0.71 to 0.92) 0.85 (0.73 to 0.99) Renal disease 1.30 (1.20 to 1.40) 0.76 (0.69 to 0.84) Lung neoplasm 5.64 (5.10 to 6.23) 4.81 (4.22 to 5.47) Respiratory arrest/failure 3.06 (2.92 to 3.22) 2.39 (2.25 to 2.53) Pneumonia 1.84 (1.73 to 1.95) 1.45 (1.36 to 1.54) 7 1.28 (1.19 to 1.39) 1.31 (1.20 to 1.43) Chronic obstructive pulmonary disease 1.52 (1.39 to 1.67) 1.36 (1.22 to 1.52) Other respiratory disease 2.51 (2.39 to 2.64) 1.63 (1.54 to 1.73) Blood urea nitrogen (mg/dL) - 1.01 (1.01 to 1.01) Blood total white blood cell (X109/L) - 1.01 (1.01 to 1.01) Serum albumin (g/dL) - 0.53 (0.52 to -0.54) Serum creatinine (mg/dL) - 0.97 (0.96 to 0.98) 2001 1.22 (1.17 to 1.27) 1.06 (1.01 to 1.12) 2002 1.17 (1.13 to 1.22) 1.08 (1.03 to 1.14) 2003 1.11 (1.06 to 1.15) 1.05 (1.00 to 1.11) 2004 1.07 (1.03 to 1.12) 1.04 (0.99 to 1.09) Hemoglobin level (per g/dL) 1.22 (1.20 to 1.25) 1.16 (1.14 to 1.19) Heart disease 0.82 (0.76 to 0.88) 0.81 (0.75 to 0.88) ICU admission for unstable angina 1.80 (0.98 to 3.39) 2.05 (0.97 to 4.35) ICU admission for congestive heart failure 0.88 (0.73 to 1.05) 0.92 (0.75 to 1.14) ICU admission for acute myocardial infarction 0.78 (0.69 to 0.88) 0.88 (0.76 to 1.02) 0.81 0.84 Infection Other laboratory tests Fiscal year (Reference: 2005) Interaction of blood transfusion with C-statistic for model 8 Table 4: Parameter estimates on the logit of hospital mortality for Hgb as a categorical variable Categorical variable for Hgb Whole group (n=258,826) Subset (n=182,792) 6.1 to 7.0 1.547 0.994 7.1 to 8.0 1.229 0.715 8.1 to 9.0 0.885 0.468 9.1 to 10.0 0.605 0.315 (reference: >10 g/dL) 9 Table 5: Parameter estimates on the logit of hospital mortality for the interaction of Hgb as a categorical variable with transfusion receipt during first 30 days of ICU admission Categorical variable for Hgb Whole group (n=258,826) Subset (n=182,792) 6.1 to 7.0 -1.505 -1.210 7.1 to 8.0 -1.230 -1.054 8.1 to 9.0 -1.058 -0.859 9.1 to 10.0 -0.854 -0.707 (reference: >10 g/dL) 10 Figure 1 Model-predicted probability of hospital mortality with and without transfusion across nadir hemoglobin (Hgb) levels for subgroup of Veterans Affairs ICU episodes with additional blood test results (n=182,792) A. No comorbid heart disease admitted to ICU for reference medical diagnoses; B. Comorbid heart disease admitted to ICU for reference medical diagnoses; C. Comorbid heart disease admitted to ICU for acute myocardial infarction; For a 60-year old male transferred to ICU and stayed for 30 days in fiscal year 2005. ICU = intensive care unit; black lines: no transfusion; blue lines: transfusion; unbroken lines: point estimates; broken lines: 95% confidence limits. 11 Figure 2 Parameter estimates on the logit of hospital mortality for Hgb as a categorical variable in regression models A. Hgb category coefficients (reference: Hgb >10 g/dL); B. Hgb category*transfusion interaction coefficients (reference: Hgb >10g/dL*transfusion). 12 Reference 1. Elixhauser A, Steiner C, Harris DR, Coffey RM. Comorbidity measures for use with administrative data. Med Care. 1998;36(1):8-27. 13


