ONLINE SUPPLEMENT RESULTS S2 Multivariate logistic
advertisement
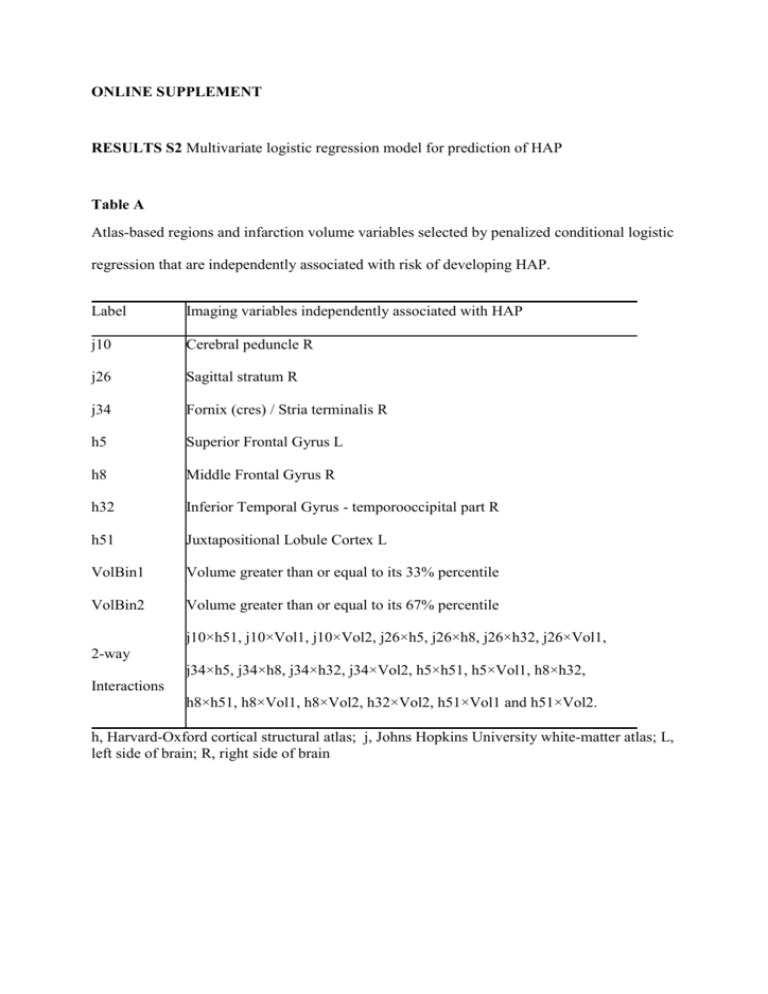
ONLINE SUPPLEMENT RESULTS S2 Multivariate logistic regression model for prediction of HAP Table A Atlas-based regions and infarction volume variables selected by penalized conditional logistic regression that are independently associated with risk of developing HAP. Label Imaging variables independently associated with HAP j10 Cerebral peduncle R j26 Sagittal stratum R j34 Fornix (cres) / Stria terminalis R h5 Superior Frontal Gyrus L h8 Middle Frontal Gyrus R h32 Inferior Temporal Gyrus - temporooccipital part R h51 Juxtapositional Lobule Cortex L VolBin1 Volume greater than or equal to its 33% percentile VolBin2 Volume greater than or equal to its 67% percentile j10×h51, j10×Vol1, j10×Vol2, j26×h5, j26×h8, j26×h32, j26×Vol1, 2-way j34×h5, j34×h8, j34×h32, j34×Vol2, h5×h51, h5×Vol1, h8×h32, Interactions h8×h51, h8×Vol1, h8×Vol2, h32×Vol2, h51×Vol1 and h51×Vol2. h, Harvard-Oxford cortical structural atlas; j, Johns Hopkins University white-matter atlas; L, left side of brain; R, right side of brain Table B Estimates of regression coefficients for imaging predictors and matching variables. x J10 J26 J34 H5 H8 H32 H51 VolBin1 b̂ -0.0701 0.4477 0.5684 1.4619 1.5089 3.1619 3.1834 0.4651 x VolBin2 J10 x H51 J10 x VolBin1 J10 x VolBin2 J26 x H5 J26 x H8 J26 x H32 J26 x VolBin1 b̂ 0.9045 -1.3149 1.9953 -0.9385 1.3881 -1.6748 -3.9846 0.7036 x J34 x H5 J34 x H8 J34 x H32 J34 x VolBin2 H5 x H51 H5 x VolBin1 H8 x H32 H8 x H51 b̂ 0.4764 -0.5224 -0.2467 -0.0170 -2.1236 -2.5078 0.4950 -0.5704 x H8 x VolBin1 H8 x VolBin2 H32 x VolBin2 H51 x VolBin1 H51 x VolBin2 b̂ -0.5420 -0.3358 -0.7411 -1.4241 -0.9733 z Age Sex NIHSS gˆ 0.0049 0.1991 0.0837 Note: Binary variables: VolBin1 = IéëVolume ³ Q33 ( Volume)ùû, VolBin2 = IéëVolume ³ Q67 ( Volume)ùû , Sex (1=male, 0=female). Continuous integer variable: Age (years), NIHSS. Intercept a = -3.9381 The imaging variables listed in Table A are part of the multivariate model to predict HAP. Equation 1 in Methods S1 (online supplement) indicates how the values of these variables (summarized as vectors, X and Z) are combined (using the estimates of the coefficients b and g with intercept a in Table S4) to calculate probability of HAP.

