nph4311-sup-0002
advertisement
Supporting Information Notes S1 Details about the bio-informatic analyses
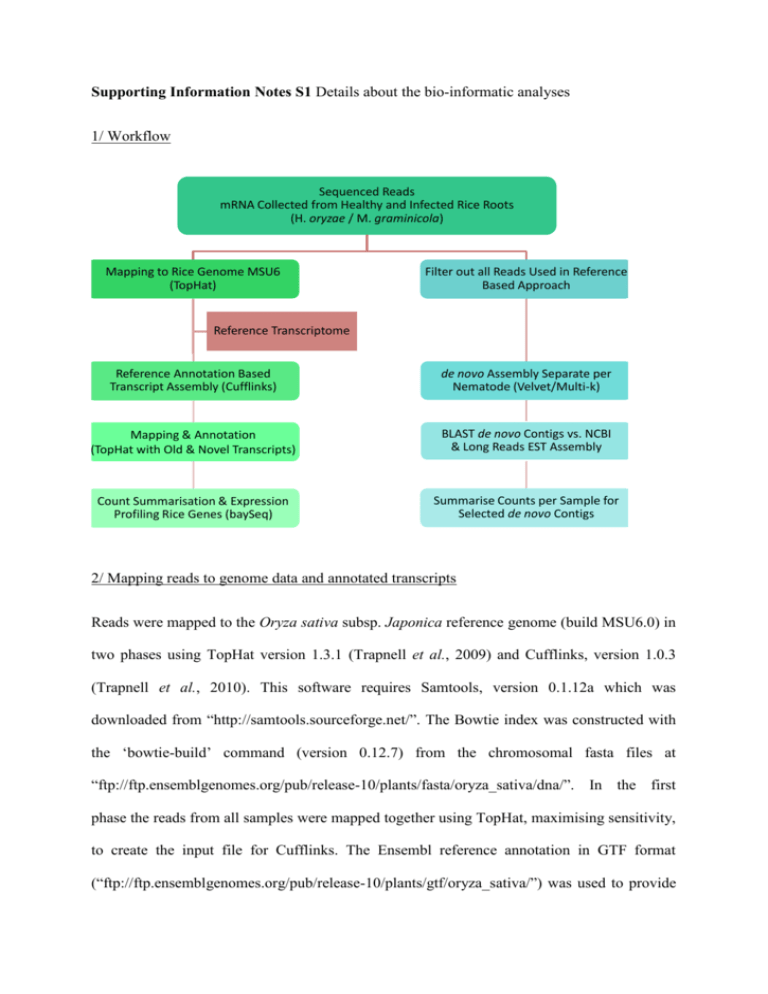
1/ Workflow
Sequenced Reads
mRNA Collected from Healthy and Infected Rice Roots
(H. oryzae / M. graminicola)
Mapping to Rice Genome MSU6
(TopHat)
Filter out all Reads Used in Reference
Based Approach
Reference Transcriptome
Reference Annotation Based
Transcript Assembly (Cufflinks)
de novo Assembly Separate per
Nematode (Velvet/Multi-k)
Mapping & Annotation
(TopHat with Old & Novel Transcripts)
BLAST de novo Contigs vs. NCBI
& Long Reads EST Assembly
Count Summarisation & Expression
Profiling Rice Genes (baySeq)
Summarise Counts per Sample for
Selected de novo Contigs
2/ Mapping reads to genome data and annotated transcripts
Reads were mapped to the Oryza sativa subsp. Japonica reference genome (build MSU6.0) in
two phases using TopHat version 1.3.1 (Trapnell et al., 2009) and Cufflinks, version 1.0.3
(Trapnell et al., 2010). This software requires Samtools, version 0.1.12a which was
downloaded from “http://samtools.sourceforge.net/”. The Bowtie index was constructed with
the ‘bowtie-build’ command (version 0.12.7) from the chromosomal fasta files at
“ftp://ftp.ensemblgenomes.org/pub/release-10/plants/fasta/oryza_sativa/dna/”. In the first
phase the reads from all samples were mapped together using TopHat, maximising sensitivity,
to create the input file for Cufflinks. The Ensembl reference annotation in GTF format
(“ftp://ftp.ensemblgenomes.org/pub/release-10/plants/gtf/oryza_sativa/”) was used to provide
established junctions (-G). Further, standard parameters were used with exception of
following options: underlying Bowtie algorithm considered base quality scores for mapping (-bowtie-n), a single read mismatch was allowed in initial mapping (--initial-read-mismatches),
no more than 10 mappings allowed for a single read (-g 10), exon junctions required at least
10 bp to be covered on either side (-a 10) with no more than a single mismatch in this so
called “anchor” region (-m 1), the minimum intron length was set to 30 bp (-i 30) and solexa
1.3 (--solexa1.3-quals) quality values were used in accordance with the raw data format. The
next step consisted of applying Cufflinks to construct a minimal set of transcripts using
reference annotation based transcript (RABT) assembly (Roberts et al., 2011), again based on
the Ensembl MSU6 GTF annotation file. Standard settings were used with the exception of
following options: reads mapping to multiple locations where weighted in each location (see
Cufflinks manual for more details) and intron length was allowed to vary between 30 bp and
500000 bp. In the second phase all samples were remapped separately using the same TopHat
settings with the following two exceptions: the ‘transcripts.gtf’ output from Cufflinks was
used to supply junctions and ‘--no-novel-juncs’ was added to prevent TopHat from
introducing new sample specific junctions that were not detected in the first phase.
3/ Identification of novel transcriptionally active regions
The Cufflinks program used in the first stage of read mapping also generates a GTF file
including all transcripts annotated in MSU6 and putative novel transcripts derived from our
data. All putative nTARs marked as splice variants of known genes were excluded, resulting
in an initial list of 8,290 putative nTARs. A manual inspection of the corresponding locations
revealed that some of these putative nTARs were still located within intronic regions. As it
cannot be completely excluded that reads located in the introns of previously annotated genes
might have originated from yet unspliced transcripts, these nTARs were disregarded in further
(nTAR related) analyses. The 4,684 remaining nTARs were compared by BLASTN (E<1e-4)
with the nTARs from our previous analysis on rice root tips and mature root tissue [17]. We
also performed a local BLAST search (BLAST 2.2.25+) against NCBI’s nt, est_others,
refseq_genomic,
refseq_rna
and
other_genomic
databases
downloaded
from
“ftp://ftp.ncbi.nlm.nih.gov/blast/db/” on the 12th of August 2011. Settings for the BLAST
search matched those of NCBI’s megaBLAST service with the exception that all filters were
turned off. We also included the MSU6 genome in the databases searched.
Verification of transcript annotation by BLAST was performed in BioPerl 1.6.1 using the
“RemoteBLAST” module. BLASTx searches were performed against the Swiss-Prot and
trEMBL database (November 15, 2011) and all predicted rice proteins (file ‘all.pep’ version
6.1 on http://rice.plantbiology.msu.edu/), with an E-value cut-off of 1e-4. Homologues of the
nTARs in rice ESTs (downloaded from NCBI dbEST) were searched by tBLASTx (E<1e-4).
4/ Calculation, normalization and profiling of gene expression
Expression was quantified per sample and per annotated or unannotated locus as the sum
(count) of all reads mapped to the respective gene exons. Splice variants were treated as a
single gene. The mapping parameters in TopHat allow multiple locations to be reported per
sequenced fragment. This complicates quantification of the absolute amount of transcriptional
activity. In this paper however we focus on the relative gene expression between conditions,
which is less affected since reads mapping to an ambiguous region will most likely map in a
similar fashion across samples.
Expression profiles were assessed using the R-package “baySeq”, version 1.5.1. (Hardcastly
& Kelly, 2010) which implements a Bayesian approach to allocate likelihoods that a given
variable supports a predefined set of models. We defined different models of interest for the
sequencing data depending on the subset of samples under consideration. Depending on the
tissue type, 2 or 3 independent biological samples, each originating from a pool of 6 plants,
were analysed.
All likelihoods were estimated using the negative binomial model and standard options with
following exceptions: priors were estimated with 10-fold sampling of all variables, posteriors
were estimated with 10 bootstraps. baySeq takes into account differences in gene length (here
estimated by the summed exon length) and library size (total sum of reads per sample). To
compensate for artificial differences in read distributions, baySeq was provided with adjusted
library sizes. The original library sizes were multiplied by additional normalisation factors per
sample that were calculated using the methods described in Robinson & Oshlack (2010) with
standard settings as implemented in the edgeR package (version 2.0.3). Recent versions of the
baySeq package (1.5 or higher) also provide false discovery rates (FDRs). Genes were
deemed to be significant for a given model (ie. “equal expression”, "differentially expressed")
when the FDR for that gene in this specific model was below 0.05. The expression level of
each transcript for each condition was estimated as the average number of reads detected
across the biological replicates. The fold change (FC) is calculated as the ratio of the average
number of reads +1 (to avoid 0-values) in the different conditions. Log2-values of FC were
used for further analyses.
5/ Detection of nematode transcripts in infected tissues
The nature of the sample preparation allowed us not only to examine the rice transcriptome
but simultaneously capture that of the invading nematodes. Since no reference genomes are
available neither for H. oryzae nor for M. graminicola, we opted for a de novo assembly
method using only those reads that could not be mapped in the reference rice annotation
approach (termed “unmapped fraction”). Nematode transcripts were detected by applying de
novo transcript assembly techniques to those reads that could not be mapped to the Oryza
sativa MSU6 genome. A workflow representation is included in Supplementary Figure S5.
First, transcript contigs were assembled using Velvet (v1.1.07, Zerbino et al., 2008) with
variable k-mer lengths (k={43,47,53,57}). This was done separately for the root knot
nematode infected and the migratory nematode infected samples irrespective of time after
infection. For each assembly the program default parameters were used with the addition of ‘read_trkg yes’. The contig files from each assembly were then merged per nematode using the
multi-K method described in Surbet-Groba et al. (2010). To check for their origin, these
contigs were BLASTed against the rice genome (MSU6.0) and against a set of EST contigs
assembled from long reads (Roche 454 sequencing) available in our lab for both nematodes:
M. graminicola (Haegeman A. et al. unpublished) and H. oryzae (Bauters L. et al.
unpublished) (E<1e-15).
