Figure 5.2 provides information on academic
University of Leeds - academic staff turnover by protected characteristic 1 August 2011 – 31 July 2012
12%
10%
8%
6%
4%
2%
0%
The following data provides information on academic staff across the university who voluntarily resigned over the period August 2011 – July 2012, by protected characteristic and contract type. A total of 176 academic staff resigned out of a total academic population of
3106, equating to a 6% staff turnover rate.
Figure 1. Age
Academic staff turnover by age
11%
8%
4%
3%
2%
20 - 29 30 - 39 40 - 49 50 - 59 60 +
Under 20
20 - 29
30 - 39
40 - 49
50 - 59
60 +
Total staff
0
302
997
915
615
277
Voluntary
Leavers
0
32
84
34
21
5
% Turnover
0%
11%
8%
4%
3%
2%
TOTAL 3106 176 6%
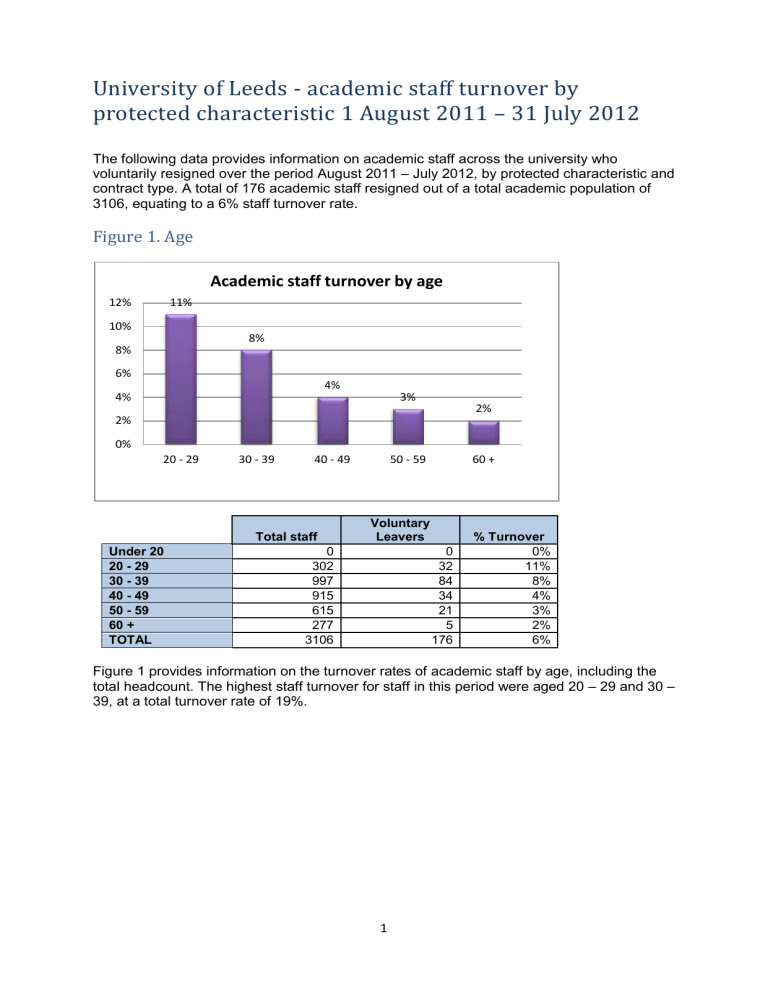
Figure 1 provides information on the turnover rates of academic staff by age, including the total headcount. The highest staff turnover for staff in this period were aged 20 – 29 and 30 –
39, at a total turnover rate of 19%.
1
Figure 2. Caring Responsibility 1
Academic staff turnover by caring responsibility
7%
6%
5%
4%
3%
2%
1%
5% 5%
6% 6%
0%
Yes No Prefer not to answer
Unknown
Yes
No
Prefer not to answer
Unknown
Total staff
716
911
467
1012
3106
Voluntary
Leavers
36
50
26
64
176
% Turnover
5%
5%
6%
6%
6% TOTAL
Figure 2 provides information on the turnover rates of academic staff by caring responsibility.
In total, 5% of academic staff who declared they had a caring responsibility, resigned.
1 Defined as: caring for either one or more children, one or more disabled children, a relative or family member
2
Figure 3. Disability
Academic staff turnover by disability
10%
9%
8%
7%
6%
5%
4%
3%
2%
1%
0%
3%
5%
7%
Disabled Non disabled Prefer not to answer
9%
Unknown
Disabled
Non disabled
Prefer not to answer
Unknown
TOTAL
Total staff
109
2441
349
207
3106
Voluntary
Leavers
3
130
24
19
176
% Turnover
3%
5%
7%
9%
6%
Figure 3 provides information on the turnover rates of academic staff by disability. Of the total number of academic staff who stated they had a disability, 3% resigned. In comparison, of the academic staff who stated they were non disabled, 5% resigned.
3
Figure 4. Ethnicity
Academic staff turnover by ethnicity
10%
9%
8%
7%
6%
5%
4%
3%
2%
1%
0%
9%
5%
7%
9%
BME White Prefer not to answer
Unknown
BME
White
Prefer not to answer
Total staff
335
2179
Voluntary
Leavers
31
100
% Turnover
9%
5%
Unknown
334
258
23
22
7%
9%
TOTAL 3106 176 6%
Figure 4 provides information on the turnover rates of academic staff by ethnicity. Of the total academic staff population who declared their ethnicity as Black or Minority Ethnic, 9% resigned. In comparison, of the total academic staff who declared their ethnicity as White,
5% resigned.
4
Figure 5. Gender
4%
3%
2%
1%
0%
7%
6%
5%
Academic staff turnover by gender
6% 6%
Female
Male
TOTAL
Contract type
Female
Total staff
1266
1840
3106
Male
Voluntary
Leavers
74
102
176
% Turnover
6%
6%
6%
10%
5.1 Academic staff turnover by contract type
9%
8%
6%
4%
2%
0%
3%
Fixed term Permanent
Fixed term
Permanent
TOTAL
Total staff
1353
1753
3106
Voluntary
Leavers
123
53
176
%
Turnover
9%
3%
6%
5
Contract status
5.2 Academic staff turnover by contract status
7%
4%
3%
2%
1%
0%
8%
7%
6%
5%
5%
Full time Part time
Full time
Part time
TOTAL
Total staff
2402
704
3106
Voluntary
Leavers
129
47
176
%
Turnover
5%
7%
6%
Figure 5 provides information on the turnover rates of academic staff by gender. A total of
6% of female academic staff population, and a total of 6% of male academic staff population resigned.
Figure 5.1 provides information on academic staff turnover rates by contract type. Of the academic staff working on a fixed term contract, 9% resigned compared to 3% of academic staff working on a permanent contract.
Figure 5.2 provides information on academic staff turnover by contract status. Of the academic staff working full time, 5% resigned, compared to 7% of academic staff working part time.
6
Figure 6. Religion
Academic staff turnover by religion
25%
20%
15%
10%
5%
0%
8%
4%
20%
5% 5%
0%
8%
5%
6% 6%
Buddhist
Christian
Hindu
Jewish
Muslim
Sikh
Other religion
None
Prefer not to answer
Unknown
TOTAL
Total staff
25
631
30
19
37
5
26
772
549
1012
3106
Voluntary
Leavers
2
24
6
1
2
0
2
41
34
64
176
% Turnover
8%
4%
20%
5%
5%
0%
8%
5%
6%
6%
6%
Figure 6 provides information on the turnover rates of academic staff by religion. The largest academic staff turnover was amongst Hindu staff, at 20%, following by Buddhist staff and staff with other religious beliefs (at 8%). In addition, of the academic staff who did not answer the question relating to their religion, 6% resigned.
Please note: it is difficult to identify meaningful trends as the data sets are too small.
7
Figure 7. Sexual Orientation
10%
9%
8%
7%
6%
5%
4%
3%
2%
1%
0%
Academic staff turnover by sexual orientation
9%
7%
6%
5% 5%
6%
0%
Bisexual
Gay man
Total staff
27
23
Voluntary
Leavers
2
2
%
Turnover
7%
9%
Gay woman/lesbian
Heterosexual/straight
Other
22
1438
1
73
5%
5%
Prefer not to answer
Unknown
TOTAL
9
575
1012
3106
0
34
64
176
0%
6%
6%
6%
Figure 7 provides information on the turnover rates of academic staff by sexual orientation.
Of the total academic staff population who stated they were a gay man, 9% resigned.
Of the total academic staff population who stated they were bisexual, 7% resigned.
Of the total academic staff population who stated they were heterosexual / straight, 5% resigned. A large proportion academic staff did not answer the monitoring question relating to their sexual orientation (6%) and there is a large proportion of unknown data (6%).
Please note: it is difficult to identify meaningful trends as the data sets are too small.
8


