Optics Worksheet
advertisement
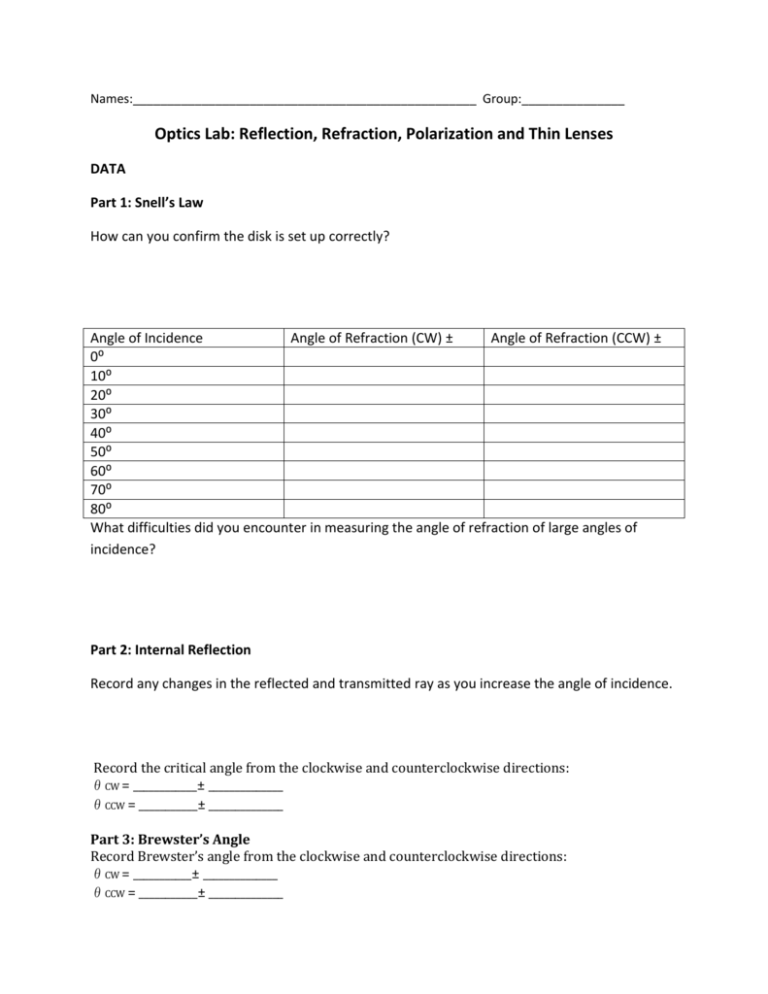
Names:__________________________________________________ Group:_______________ Optics Lab: Reflection, Refraction, Polarization and Thin Lenses DATA Part 1: Snell’s Law How can you confirm the disk is set up correctly? Angle of Incidence Angle of Refraction (CW) ± Angle of Refraction (CCW) ± 0⁰ 10⁰ 20⁰ 30⁰ 40⁰ 50⁰ 60⁰ 70⁰ 80⁰ What difficulties did you encounter in measuring the angle of refraction of large angles of incidence? Part 2: Internal Reflection Record any changes in the reflected and transmitted ray as you increase the angle of incidence. Record the critical angle from the clockwise and counterclockwise directions: θCW = ____________± ______________ θCCW = ___________± ______________ Part 3: Brewster’s Angle Record Brewster’s angle from the clockwise and counterclockwise directions: θCW = ___________± ______________ θCCW = ___________± ______________ Is the reflected light plane polarized? If so, at what angle from the vertical is the plane of polarization? Was the light still plane polarized when not at Brewster’s angle? DATA ANALYSIS Part 1: Snell’s Law Attach plots for Snell’s Law and index of refraction. Remember to clearly label the graphs and include linear fits. Are your graphs consistent with Snell’s Law? Explain. For Part 1, you encountered difficulties measuring the angle of refraction at large angles of incidence. How would you take this into account in the analysis of your data? Report the index of refraction from each of these graphs. nCW=___________± ______________ nCCW=___________± ______________ Calculate the weighted average (show your work): n=___________± ______________ Part 2: Internal Reflection Calculate the index of refraction (show your work): n=___________± ______________ Part 3: Brewster’s Angle Calculate the index of refraction (show your work): n=___________± ______________ Discussion Questions Compare your results for the index of refraction with the value of 1.49 for acrylic. Which of your measurements is the most precise? Which is the most accurate? What is the largest source of error in the experiment? How would you improve the experiment in the future? Lab: Thin Lenses Part 1 Data: Ray Tracing – any general comments? Part 2: Optic Bench Work Convex lens: p up q uq Qualitatively describe what happens when p approaches f. What effects does the BLUE filter have on your image? Is the image sharper with or without the filter? Does the image distance increase or decrease? What effects does the RED filter have on your image? Is the image sharper with or without the filter? Does the image distance increase or decrease? Analysis Calculate f for each pair of measurements in the table. Find the average and calculate the standard error. Discussion Questions Summarize your diagram from part 1 – when do you have a virtual image? When does this occur in the real world? How accurately are you able to determine f in part 2? How can you determine f quickly for any lens if you don’t have a light table setup and the lens isn’t labeled? Based on observations made in part 2, what can you conclude about the dependence of the index of refraction on the frequency of light? Does n increase or decrease with increasing frequency? What kinds of lenses are used in eyeglasses? Why? Can you use the simulation linked in the lab writeup to build a microscope or a telescope? What designs/arrangements work best to magnify? How would you improve these labs?
