Supplementary Table 1. Mean serum uric acid (SUA) in males and
advertisement
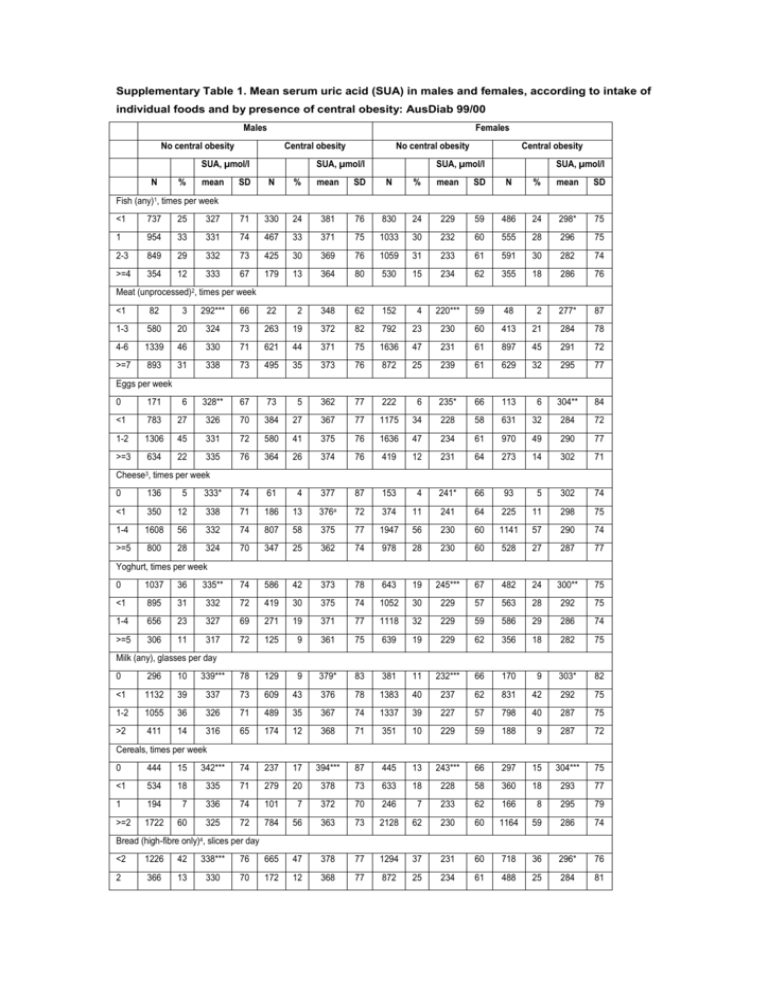
Supplementary Table 1. Mean serum uric acid (SUA) in males and females, according to intake of individual foods and by presence of central obesity: AusDiab 99/00 Males Females No central obesity Central obesity SUA, µmol/l N Fish (any)1, % mean No central obesity SUA, µmol/l SD N % mean SD Central obesity SUA, µmol/l SUA, µmol/l N % mean SD N % mean SD times per week <1 737 25 327 71 330 24 381 76 830 24 229 59 486 24 298* 75 1 954 33 331 74 467 33 371 75 1033 30 232 60 555 28 296 75 2-3 849 29 332 73 425 30 369 76 1059 31 233 61 591 30 282 74 >=4 354 12 333 67 179 13 364 80 530 15 234 62 355 18 286 76 Meat (unprocessed)2, times per week <1 82 3 292*** 66 22 2 348 62 152 4 220*** 59 48 2 277* 87 1-3 580 20 324 73 263 19 372 82 792 23 230 60 413 21 284 78 4-6 1339 46 330 71 621 44 371 75 1636 47 231 61 897 45 291 72 >=7 893 31 338 73 495 35 373 76 872 25 239 61 629 32 295 77 Eggs per week 0 171 6 328** 67 73 5 362 77 222 6 235* 66 113 6 304** 84 <1 783 27 326 70 384 27 367 77 1175 34 228 58 631 32 284 72 1-2 1306 45 331 72 580 41 375 76 1636 47 234 61 970 49 290 77 >=3 634 22 335 76 364 26 374 76 419 12 231 64 273 14 302 71 74 61 4 377 87 153 4 241* 66 93 5 302 74 Cheese3, 0 times per week 136 5 333* <1 350 12 338 71 186 13 376a 72 374 11 241 64 225 11 298 75 1-4 1608 56 332 74 807 58 375 77 1947 56 230 60 1141 57 290 74 >=5 800 28 324 70 347 25 362 74 978 28 230 60 528 27 287 77 Yoghurt, times per week 0 1037 36 335** 74 586 42 373 78 643 19 245*** 67 482 24 300** 75 <1 895 31 332 72 419 30 375 74 1052 30 229 57 563 28 292 75 1-4 656 23 327 69 271 19 371 77 1118 32 229 59 586 29 286 74 >=5 306 11 317 72 125 9 361 75 639 19 229 62 356 18 282 75 Milk (any), glasses per day 0 296 10 339*** 78 129 9 379* 83 381 11 232*** 66 170 9 303* 82 <1 1132 39 337 73 609 43 376 78 1383 40 237 62 831 42 292 75 1-2 1055 36 326 71 489 35 367 74 1337 39 227 57 798 40 287 75 >2 411 14 316 65 174 12 368 71 351 10 229 59 188 9 287 72 Cereals, times per week 0 444 15 342*** 74 237 17 394*** 87 445 13 243*** 66 297 15 304*** 75 <1 534 18 335 71 279 20 378 73 633 18 228 58 360 18 293 77 1 194 7 336 74 101 7 372 70 246 7 233 62 166 8 295 79 >=2 1722 60 325 72 784 56 363 73 2128 62 230 60 1164 59 286 74 Bread (high-fibre only)4, slices per day <2 1226 42 338*** 76 665 47 378 77 1294 37 231 60 718 36 296* 76 2 366 13 330 70 172 12 368 77 872 25 234 61 488 25 284 81 3-4 931 32 325 69 417 30 367 77 1186 34 232 61 700 35 289 71 >=5 371 13 318 68 147 10 362 70 100 3 221 60 81 4 291 70 Pieces of fresh fruit per day <1 901 31 337** 75 462 33 379 73 675 20 236*** 60 420 21 296*** 72 1 865 30 332 70 405 29 374 77 1017 29 228 59 530 27 298 76 2 678 23 326 73 320 23 367 80 1026 30 233 62 577 29 289 76 >=3 450 16 319 69 214 15 358 76 734 21 230 61 460 23 279 74 AusDiab participants were asked to recall their usual eating habits averaged over the past 12 months. Intake categories were constructed based on participant responses, to best reflect the patterns of consumption of individual food types as reported by this cohort. * P-value for linear trend, model adjusted for age (continuous), BMI (continuous), eGFR (CKD-EPI, continuous), presence of hypertension, presence of diabetes, alcohol intake above 10g/day, selfreported history of gout at baseline, 1h or more of vigorous physical activity in the past week, energy intake (kj/day, continuous) *P<0·05, **P<0·01, ***P<0∙001 1 Average number of times over the last 12 months that fish (steamed, grilled, baked, fried or tinned) was consumed 2 Average number of times over the last 12 months that beef, veal, chicken, lamb and/or pork were consumed 3 Average 4 number of times that cheese was consumed over the past 12 months. The usual number of slices of bread consumed per day for those who normally eat high fibre white bread, wholemeal bread, rye bread or multi-grain bread, including fresh and toasted bread.
