Analyze Assessments
advertisement
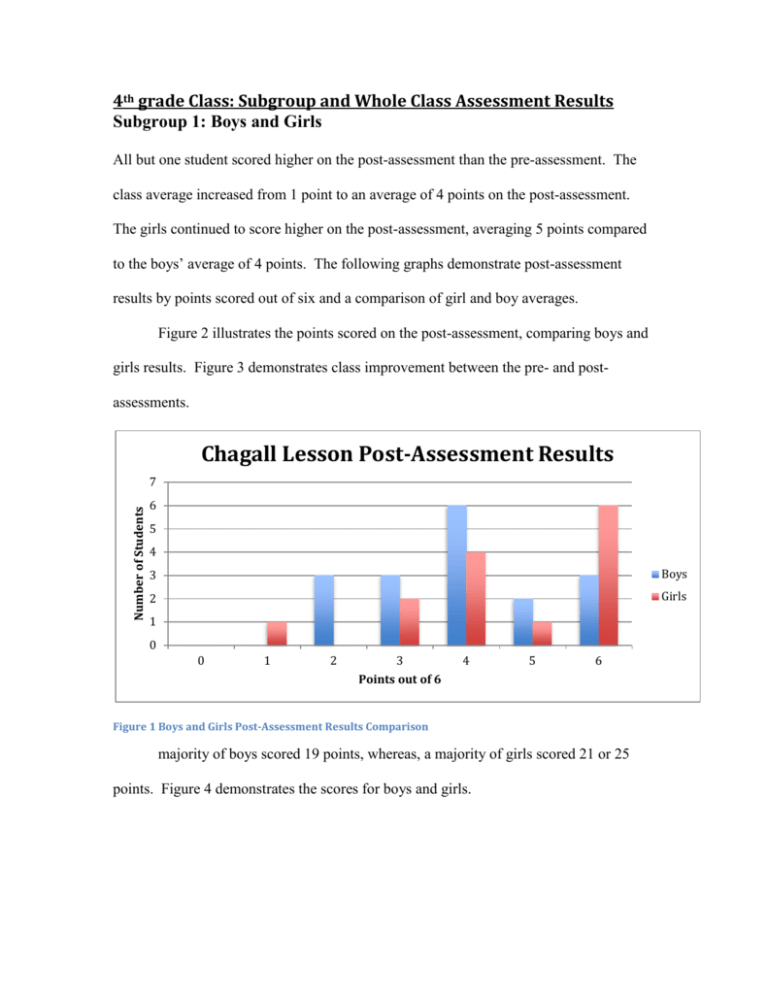
4th grade Class: Subgroup and Whole Class Assessment Results Subgroup 1: Boys and Girls All but one student scored higher on the post-assessment than the pre-assessment. The class average increased from 1 point to an average of 4 points on the post-assessment. The girls continued to score higher on the post-assessment, averaging 5 points compared to the boys’ average of 4 points. The following graphs demonstrate post-assessment results by points scored out of six and a comparison of girl and boy averages. Figure 2 illustrates the points scored on the post-assessment, comparing boys and girls results. Figure 3 demonstrates class improvement between the pre- and postassessments. Chagall Lesson Post-Assessment Results Number of Students 7 6 5 4 3 Boys 2 Girls 1 0 0 1 2 3 Points out of 6 4 5 6 Figure 1 Boys and Girls Post-Assessment Results Comparison majority of boys scored 19 points, whereas, a majority of girls scored 21 or 25 points. Figure 4 demonstrates the scores for boys and girls. Subgroup 2: Four IEP students Three of the four IEP students did very well; only one of these students did not complete his/her artwork. The final artwork of these students was complex and insightful. The Eastern Shoshone student represented his culture through the piece by including images of cultural traditions he participates in. Another student who struggles with handwriting created an accurately proportioned and detailed piece. One Student: The student who did not complete the project provided insight for accommodations in future projects. For instance, a variety of tools, calendars and magazines would help the student brainstorm ideas and stencils would aid in drawing shapes and figures. If the student is still struggling, the use of computers to make pictures created by the student that could be colored by hand; this eliminates the drawing stages. Whole Class: Number of Students Chagall Lesson Pre and Post Assessment Comparison 11 10 9 8 7 6 5 4 3 2 1 0 Pre Test Post Test 0 1 2 3 4 Points out of 6 Figure 2 Pre- and Post-Assessment Comparison 5 6 At the beginning, some students voiced reluctance to altering known images and rising to the challenge of surrealism. The student samples in Appendix C demonstrate the success students achieved after applying their knowledge of surrealism and cubism. The original works were evaluated on craftsmanship, creativity/aesthetics and remaining on task. Craftsmanship refers to clear and concise shapes and lines defined by rich colors presented in markers, crayons or pastels. The creativity and aesthetic category refers to student originality, ability to emphasize surrealism and cubism techniques, and visually appealing presentation. Finally, students were assessed on their ability to complete the project in a timely manner and use materials responsibly. The original works artwork assessment is based on a total of 25 points. The class averaged a score of 20 points. According to the post-assessment, all students did gain new knowledge in the art content presented on Chagall, surrealism and cubism. Further in-class discussions on Chagall, surrealism, and cubism and conferencing with individual students showed their interest in the content. Many students were able to recall details about Marc Chagall’s life from Hoepler’s book Marc Chagall: Life is a Dream (1998). This book engaged students with a story of Chagall’s life and showed his most famous paintings. On several occasions I found students leafing through the books provided to gather ideas and marvel at his innovative style. 7th Grade Class: Subgroup and Whole Group Assessment Results All five students that are tier 3 for RTI did better on the post-test. Student one, two and three did better by one answer. Student three did better by three answers and student four by four. The student with cerebral palsy did not do better on the post assessment, in fact did worse. This is understandable, as it is very difficult for him to move at the quick pace that the rest of the class moved at. I had his aid re-read the questions to him and narrow his choices to two from four on all multiple choice. This gives him the opportunity to participate, but again, it is not an accurate assessment of his knowledge. As a whole, the class did much better on the post assessment. The class even stopped me during the post-assessment to explain further question number 2. They needed specification as to whether the question was referring to a plant or animal cell. I was impressed. They put much more thought into the post- assessment than they did for the pre-assessment. After the post-assessment, two students told me that they remembered some of my analogies when answering questions about specific organelles. High School Spanish Class: Subgroup and Whole Group Assessment Results Analyze Assessment Results From a total number of N=33 students a statistical analysis was made to compare the two classes that took the tests. The students complete a pretest exam, with a total of 5 questions. The first group represent a class of n=12 students. The mean for the first group pretest mean was mean A= 1.92, the posttest mean A= 5. The second group represented a class with n=21 students where the pretest B=1.53 and the mean for the second group is posttest mean B=4.5. Individual: The outcome of the class A was very positive; the student’s knowledge of the test before they were exposing to the content was average (as showing on pretest). The academic grew from both classes in the posttest was very significant as shown in figure 1.1(group A) The outcome of the class B was very positive; the student’s knowledge of the test before they were exposing to the content was very low (as showing on the pretest results). The academic grew from both classes in the posttest was very significant as shown in figure 1.2 (group B) Figure 1.1 pretest postest Student 1 3 5 Student 2 2 5 Student 3 1 5 Student 4 2 5 Student 5 3 5 Student 6 3 5 Student 7 2 5 Student 8 5 5 Student 9 3 5 Student 10 2 4 Student 11 4 5 Student 12 4 5 Figure 1.2Error! Not a valid link. The students were measure and analyses based on a scale of results: 5 correct Answers Excellent Outcome 4-3 correct Answers Great Outcome 1-2 Correct Answers Low Outcome Subgroups Analyses Group A During the pretest the 34% of the class had low outcome since they only reply 1-2 answers correctly. (See figure 1.3) 50% of the class had 3 correct answers from a total of 5 questions during the pretest and 8% of the class had a perfect score during the pretest. After the students were expose to the content the posttest show that they increase outcome of five correct answers of a total of five questions. (See figure 1.4). The percentage from the outcomes was 92% of the class had excellent outcome and 8% was a great outcome. These last percentage show a student with a “great” outcome after the posttest but an observation was made, where he seem to have some difficulty while showing interest to content. Student 10 it seems to show an attitude of rejection to the lessons, but there are times where he seems participative and enthusiastic during class time. After reviewing his grades for other classes I could see how the student seems to struggle with all his classes. The lack of knowledge that I noticed is because he doesn’t study. After the lesson I saw some difficulty on him to pay attention to the lesson so I decided to incorporate a little of bit of his extracurricular activities to caught his attention. He plays football and he gets very interest with specific topics that include areas of sports. Since the lesson was about Indian education for all and compilation of food evolutions, I decided to smoothly bring him into the conversation. I talked about some of the eating habits athletes have in these days and how easy it’s for them to have access to food, when in the past to be able to eat you had to hunt. He reacted positive to this technique. He is a very smart young man. Student 4 seems to be distractive and I don’t feel lack of motivation is a problem for this student. I believe he struggle with social skills. He seems to have difficulty making friends and the class uses a lot of interactions with other students. To improve this issue I decided to incorporate a technique where I try to involve him in the bingo game, we review flashcards and he had to show the flashcards to the class. After kids interacted with him and started making jokes about him being the teacher, he felt confident to interact back, playing a teacher roll. Student 5 seem to get distracted easily, sometimes she participates , other times she seems to be doing other things that don’t apply to the class. She is one of the students that will approach me and will create conversations in Spanish. I have to constantly have an eye on her to make sure she is doing school work. These three students had a positive outcome on this specific lesson but I believe other techniques need to be implemented to reach for better results. The group B When the pretest was applied to group B, they had 52% student population with results of “low” outcome and 47% great outcome. After they were exposed to the lesson the posttest showed the 80% of the class had 5 correct answers from a total of 5 questions (see figure 1.5). The 20% had a great outcome answering 4 correct answers from 5 questions. The observation for this group is on two students. Student 16 seems to have lack of motivation and energy to work. He never presents his homework. After having a conversation with the mentor teacher it was a conclusion that all the students should have an IP to measure performance, because every student needs were different which that could be a plan to follow in the future. The student 6 she seems very bright , but very easily distracted. She don’t get the instructions at the first call, she seem to struggle to concentrate, so it makes me believe on a small disability she might have. I decide to bring this conversation with her counselor since she didn’t had any disability marked. In my opinion she could be a gifted kid with some autism. But they decision will be in the hands of professionals. Group level outcome Analyses The whole class group A was measure (see figure 1.7) The results were that 92% of the class had an excellent outcome with scores of 5 correct answers. 8% of the student’s population gave a great score with 3-4 correct answers. As we can see in the graphics (Figure 1.7) the class had a very good response to the lesson. The whole class group B was measure (see figure 1. 8) The results were that 80% student populations had an excellent outcome with scores of 5 correct answers. 20% of the student’s population had a great score with 3-4 correct answers. The group B shows a higher positive response on the lesson as a whole. The outcome percentage in the population is higher than group A. Figure 1.1 Group A (individual Analyses) Group A 6 Axis Title 5 4 3 2 1 0 stude stude stude stude stude stude stude stude stude stude stude stude nt 1 nt 2 nt 3 nt 4 nt 5 nt 6 nt 7 nt 8 nt 9 nt 10 nt 11 nt 12 pretest 3 2 1 2 3 3 2 5 3 2 4 4 postest 5 5 5 5 5 5 5 5 5 4 5 5 Figure 1.2 Group B (Individual analyses) Group B 6 Axis Title 5 4 3 2 1 0 stu de nt 1 pretest 3 postest 5 stu de nt 2 stu de nt 3 stu de nt 4 stu de nt 5 stu de nt 6 stu de nt 7 stu de nt 8 stu de nt 9 stu de nt 10 stu de nt 11 stu de nt 12 stu de nt 13 stu de nt 14 stu de nt 15 stu de nt 16 stu de nt 17 stu de nt 18 stu de nt 19 stu de nt 20 stu de nt 21 3 1 1 1 3 2 4 3 2 1 2 3 2 3 2 3 3 1 3 2 5 5 5 5 5 5 5 5 5 5 5 4 4 5 4 1 4 5 5 5 Figure 1.3 Group A (Excellent outcome category) Subgroups Analyses excellent outcome 6 5 4 3 2 1 0 student student student student student student student student student student student 1 2 3 4 5 6 7 8 9 11 12 Figure 1.4 Group A (Great outcome category) Subgroups Analyses Great outcome 4.5 4 3.5 3 2.5 great outcome 2 1.5 1 0.5 0 student 11 Figure 1.5 Group B (Excellent outcome category) Subgroup analyses Excellent outcome Group B 6 5 4 3 2 1 0 Figure Great outcome Figure 1.6 Group B (great outcome category) Subgroup analyses Great outcome 4.5 4 3.5 3 2.5 2 1.5 1 0.5 0 student 13 student 14 student 16 great outcome student 18 Figure 1.7 (Group analyses A) Class outcome group A Great Outcome Excellent Outcome Excellent Great Figure 1.8 (group analyses B) Class outcome group B great Outcome Excellent great Excelletn Outcome


