Title: Additional Table S1 Description: Data identical to Table 1
advertisement
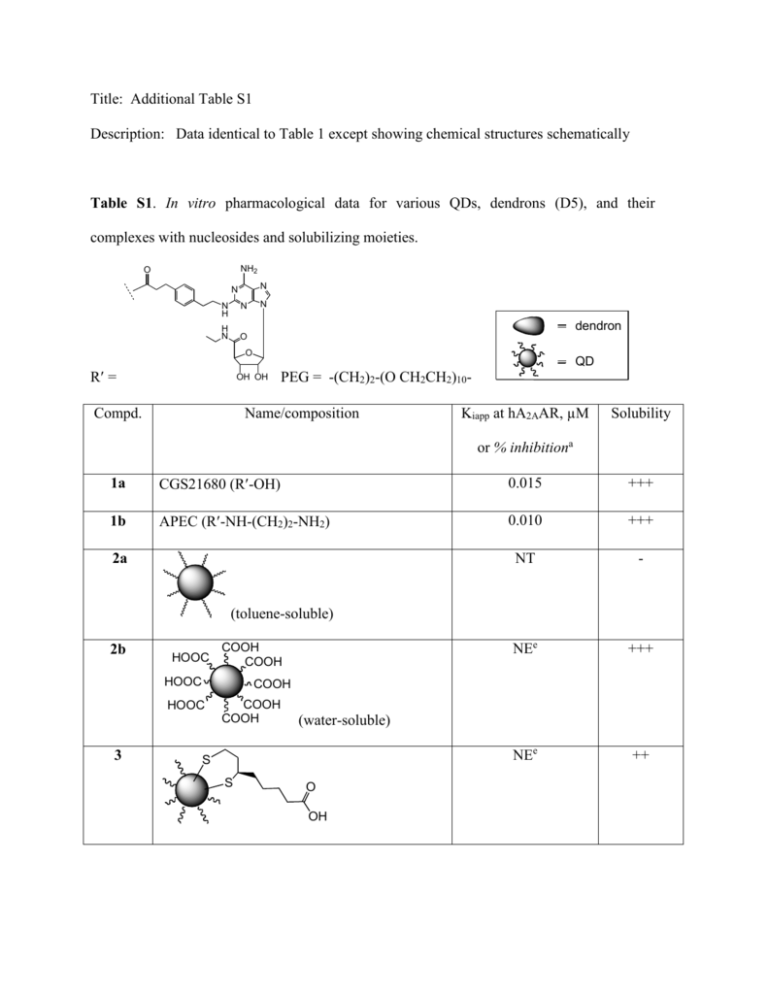
Title: Additional Table S1 Description: Data identical to Table 1 except showing chemical structures schematically Table S1. In vitro pharmacological data for various QDs, dendrons (D5), and their complexes with nucleosides and solubilizing moieties. NH2 O N N N H N H N O N dendron O R = QD OH OH Compd. PEG = -(CH2)2-(O CH2CH2)10- Name/composition Kiapp at hA2AAR, µM Solubility or % inhibitiona 1a CGS21680 (R-OH) 0.015 +++ 1b APEC (R-NH-(CH2)2-NH2) 0.010 +++ NT - NEe +++ NEe ++ 2a (toluene-soluble) 2b HOOC COOH COOH HOOC COOH HOOC 3 COOH COOH (water-soluble) S S O OH 4 S S S S S N H H N O S S S - <20%e + <20%e + <20%e ++ R' R' N H O S <20%e OH H N 5 6 + O O S <20%e N H PEG NH R' PEG NH R' OH O O 7 S 8b S R'-HN-(CH2)2-NH-CO R'-HN-(CH2)2-NH-CO R'-HN-(CH2)2-NH-CO 9 N H CO-NH-(CH2)2-NH-R' CO-NH-(CH2)2-NH-R' CO-NH-(CH2)2-NH-R' CO-NH-(CH2)2-NH-R' CO-NH-PEG-NH-R' R'-HN-PEG-NH-CO R'-HN-PEG-NH-CO R'-HN-PEG-NH-CO (72.3 nM CO-NH-(CH2)2-NH-R' CO-NH-PEG-NH-R' CO-NH-PEG-NH-R' CO-NH-PEG-NH-R' CO-NH-PEG-NH-R' in DMSO)d <20%e ++ O 10 9.8±7.4% S S (at 1.0 µM) O 11 NH (CONH)9 (CO2H)23 NH S +++ (CO2H)32 NH S O 12 S 13c n O S S +++ 2.2±1.1% +++ (CONH)9 (CO2H)23 (at 1.0 µM) 0.118±0.054 NH NH 1.02±0.15 (CO2H)32 NH S R' R' +++ n (66.1 µM in DMSO)d a All experiments were done on HEK-293 cells stably expressing the human A2AAR. The binding affinity (n = 3-5) and was determined by using agonist radioligands [3H]CGS21680. The concentrations of the ligand complexes were measured by the concentration of the macromolecule, not the attached nucleoside. Therefore, binding Ki values calculated from the IC50 using the Cheng-Prusoff equation [29] of large conjugates are expressed as Kiapp values. b 8, MRS5252. c 13, MRS5303. d In order to determine more exactly the solubility of the compounds in two cases we plotted a standard curve graph. We measured the fluorescence intensity of the underivatized QDs (2a and 2b) in DMSO at different concentrations; then, we measured the fluorescence intensity of each conjugate, 8 and 13, in DMSO to determine its maximal solubility, based on comparison to the standard curve of the chemical precursor 2a or 2b. e NE, no effect, or less than 20% inhibition at the maximal concentration tested. This concentration was intended to be 1 µM, however in most cases this was not reached due to precipitation. NT, not tested.

