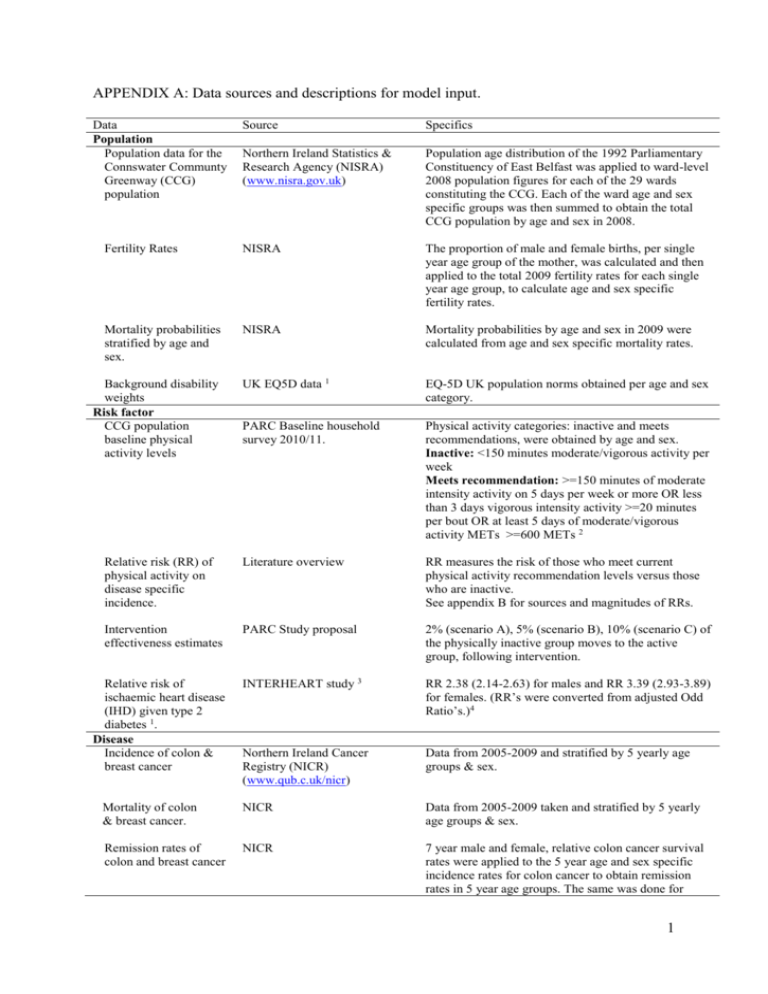
APPENDIX A: Data sources and descriptions for model input.
Data
Population
Population data for the
Connswater Communty
Greenway (CCG)
population
Source
Specifics
Northern Ireland Statistics &
Research Agency (NISRA)
(www.nisra.gov.uk)
Population age distribution of the 1992 Parliamentary
Constituency of East Belfast was applied to ward-level
2008 population figures for each of the 29 wards
constituting the CCG. Each of the ward age and sex
specific groups was then summed to obtain the total
CCG population by age and sex in 2008.
Fertility Rates
NISRA
The proportion of male and female births, per single
year age group of the mother, was calculated and then
applied to the total 2009 fertility rates for each single
year age group, to calculate age and sex specific
fertility rates.
Mortality probabilities
stratified by age and
sex.
NISRA
Mortality probabilities by age and sex in 2009 were
calculated from age and sex specific mortality rates.
UK EQ5D data 1
EQ-5D UK population norms obtained per age and sex
category.
PARC Baseline household
survey 2010/11.
Physical activity categories: inactive and meets
recommendations, were obtained by age and sex.
Inactive: <150 minutes moderate/vigorous activity per
week
Meets recommendation: >=150 minutes of moderate
intensity activity on 5 days per week or more OR less
than 3 days vigorous intensity activity >=20 minutes
per bout OR at least 5 days of moderate/vigorous
activity METs >=600 METs 2
Relative risk (RR) of
physical activity on
disease specific
incidence.
Literature overview
RR measures the risk of those who meet current
physical activity recommendation levels versus those
who are inactive.
See appendix B for sources and magnitudes of RRs.
Intervention
effectiveness estimates
PARC Study proposal
2% (scenario A), 5% (scenario B), 10% (scenario C) of
the physically inactive group moves to the active
group, following intervention.
INTERHEART study 3
RR 2.38 (2.14-2.63) for males and RR 3.39 (2.93-3.89)
for females. (RR’s were converted from adjusted Odd
Ratio’s.)4
Northern Ireland Cancer
Registry (NICR)
(www.qub.c.uk/nicr)
Data from 2005-2009 and stratified by 5 yearly age
groups & sex.
Mortality of colon
& breast cancer.
NICR
Data from 2005-2009 taken and stratified by 5 yearly
age groups & sex.
Remission rates of
colon and breast cancer
NICR
7 year male and female, relative colon cancer survival
rates were applied to the 5 year age and sex specific
incidence rates for colon cancer to obtain remission
rates in 5 year age groups. The same was done for
Background disability
weights
Risk factor
CCG population
baseline physical
activity levels
Relative risk of
ischaemic heart disease
(IHD) given type 2
diabetes 1.
Disease
Incidence of colon &
breast cancer
1
breast cancer using 10 year relative survival rates.
Prevalence of colon and
Breast cancer
DISMOD ΙΙ 5
Modeled estimates were derived from colon and breast
cancer incidence, mortality and remission data, as
detailed above.
Prevalence of IHD,
stroke & diabetes
NI Health & Social Wellbeing
Survey (NIHWB) 2005/06 6
& the General Practice Quality
and Outcomes Framework
(QOF)20097.
The age and sex distribution of prevalent cases
obtained from the 2005/06 NIHWB survey was applied
to 2009 QOF prevalence data. The QOF database is
considered to provide highly accurate disease
prevalence data but it is not stratified by age or sex,
hence the age distribution from the NIHWB survey
was used.
Incidence of IHD &
stroke
DYNAMO Health Impact
Assessment project (based on
GPRD data for the UK)
(www.dynamo-hia.eu )
This provided incidence rates by sex and single year of
age for the UK.
Remission rate of
diabetes
-
Assumed to be zero.
Incidence of diabetes
DISMOD ΙΙ 5
Type 2 diabetes prevalence, mortality, and remission
data already obtained, as detailed above, were used in
the model to derive the incidence of diabetes.
Mortality of IHD,
stroke & diabetes
NISRA
Mortality rates by sex and ten year age groups were
obtained from the annual Registrar General’s report for
2009.
Disease weights
Global Burden of Disease study
(GBD) up-dated 2004 version 8
The ‘average’ disability weights from the GBD study
for colon and breast cancer and type 2diabetes were
used.
The disability weight for ‘long term stroke survivors’
was used for the stroke disability weight as most stroke
victims in any population are likely to be long term
survivors.
To calculate an overall disability weight for IHD, the
% prevalence of myocardial infarction 9, angina and
heart failure was used to weight their individual
disability weights and calculate an overall weighted
average. Prevalence figures were obtained from the
British Heart Foundation (BHF) website which
presented GPRD data.
Disease costs
See appendix C.
2
APPENDIX B: Sources and magnitudes of relative risks for the effects of physical activity on
disease mortality.
Disease
Source
Age group
Sex
Inactive
Colon Cancer
Meta-analysis of
28 cohort and
24 case-control
studies 10.
Systematic
Review of 28
cohort and 34
case-control
studies 11.
Meta-analysis of
20 prospective
cohort studies 12.
0-85
Male
Female
1
1
Active
RR (95%CI)
0.76 (0.71-0.82)
0.79 (0.71-0.88)
0-85
Male
Female
1
1
0.75 (0.7-0.8)
16-69
Male
Female
1
1
0.58 (0.54-0.63)
0.58 (0.54-0.63)
70-79
Male
Female
Male
Female
Male
Female
1
1
1
1
1
1
0.67 (0.62-0.72)
0.67 (0.62-0.72)
0.77 (0.71-0.83)
0.77 (0.71-0.83)
0.65 (0.56-0.76)
0.65 (0.56-0.76)
Male
Female
Male
Female
Male
Female
1
1
1
1
1
1
0.72 (0.63-0.85)
0.72 (0.63-0.85)
0.81 (0.69-0.94)
0.81 (0.69-0.94)
0.69 (0.65-0.73)
0.69 (0.65-0.73)
Male
Female
Male
Female
1
1
1
1
0.76 (0.71-0.80)
0.76 (0.71-0.80)
0.83 (0.78-0.88)
0.83 (0.78-0.88)
Breast Cancer
Ischaemic heart
disease
80+
Stroke
Meta-analysis of
8 prospective
cohort studies 12.
16-69
70-79
80+
Type 2 Diabetes
Meta-analysis of
13 prospective
cohort and 9
case-control
studies 12.
16-69
70-79
80+
3
APPENDIX C: Sources and magnitudes of all cost data included in the model.
1. Total Greenway construction costs related to physical activity.
Siteworks
Footbridges
Walkways
Steps
Total
£14,140
£772,750
£3,082,105
£24,000
Grand Total
£5,531,175
Lighting
£1,638,180
All costs are in £ sterling.
2. Total Greenway maintenance costs, over 41 years, related to physical activity.
Areas of maintenance
Cost per year
Total cost over 41
years
Small Pedestrian
footbridges
£41,800
£1,713,800
Total discounted
maintenance cost over
41 years
£934,442
Bark Mulch Path
£7,268 beginning in year 2
£290,736
£155,217
Bark Footpath
£435 for first year and 938
every year after.
£37,935
£20,456
Trim traila inspection
& maintenance
£5,000
£205,000
£111,775
Trim trail
replacement
£20,000 every 10 years
£80,000
£37,681
Eco Trail
replacement
£3,000
£123,000
£67,065
£2,450,471.48
£1,326,636
Total
All costs are in £ sterling.
a
A trim trail, also called an exercise trail, combines running with exercise stations.
4
3. Disease costs per prevalent case.
Total UK
healthcare costs in
a specified year (£
millions)
663 (Prevalent
costs 2005)13
-
Costs inflated to
2009
Total UK disease prevalence
2009
Disease
cost/prevalent
case in 2009
719,763,266
100,608 (2008)14
£7,154
-
-
£8,93315
Ischaemic heart
disease
Type 2 Diabetes
3,248 (2006)16
3,446,803,584
2,330,2777
£1,479
3,270 (2002)17
3,723,034,358
2,634,2637
£1,413
Stroke
3,172 (2006)16
3,366,151,776
1,104,2797
£3,048
Colon cancer
Breast cancer
All costs are in £ sterling.
4. Total disease cost savings.
Scenario ATotal cost
savings
Discounted
Scenario BTotal cost
savings
Discounted
Scenario CTotal cost
savings
Discounted
Colon
cancer
42,924.81
17,231.16
78,695.49
33,586.28
135,928.57
57,004.44
Breast
cancer
107,198.88
41,115.62
178,664.80
73,961.44
330,529.88
135,595.20
Ischaemic
heart
disease
73,956.95
35,498.15
184,892.37
89,621.07
375,701.31
179,476.89
Type 2
diabetes
107,411.68
55,680.42
265,702.57
139,167.03
531,405.15
278,173.48
Stroke
121,931.21
62,285.94
295,683.18
144,842.79
609,656.03
295,838.41
Total
£453,423.53
£211,811.27
£1,003,638.42 £481,178.62
£1,983,220.94 £946,088.42
All costs are in £ sterling.
5
References for Appendices:
1.
Kind P, Hardman G, Macran S. UK Population Norms for EQ-5D. York: Centre of
Health Economics, University of York, 1999 172.
2.
Department of Health. UK Physical Activity Guidelines. Available at:
http://www.dh.gov.uk/en/Publicationsandstatistics/Publications/PublicationsPolicyAndGuida
nce/DH_127931. (August 2011, date last accessed)
3.
Yusuf S, Hawken S, Ounpuu S, et al. Effect of potentially modifiable risk factors
associated with myocardial infarction in 52 countries (the INTERHEART study): casecontrol study. Lancet. 2004;364(9438):937-52.
4.
Zhang J, Yu KF. What's the relative risk? A method of correcting the odds ratio in
cohort studies of common outcomes. JAMA. 1998;280(19):1690-1.
5.
Barendregt JJ, Van Oortmarssen GJ, Vos T, Murray CJ. A generic model for the
assessment of disease epidemiology: the computational basis of DisMod II. Popul Health
Metr. 2003;1(1):4.
6.
Northern Ireland Statistics and Research Agency. Northern Ireland Health and Social
Wellbeing Survey. Available from: http://www.csu.nisra.gov.uk/general%20health.pdf (June
2011, date last accessed)
7.
Department of Health. Northern Ireland Quality and Outcomes Framework. Available
at: http://www.dhsspsni.gov.uk/qof_statistics_for_ni_09_10.pdf. . (June 2011, date last
accessed)
8.
WHO. The Global Burden of Disease: 2004 Update. Available at:
www.who.int/healthinfo/global_burden_disease/GBD2004_DisabilityWeights.pdf (June
2011, date last accessed)
9.
Cadilhac DA, Magnus A, Sheppard L, Cumming TB, Pearce DC, Carter R. The
societal benefits of reducing six behavioural risk factors: an economic modelling study from
Australia. BMC public health. 2011;11:483.
10.
Wolin KY, Yan Y, Colditz GA, Lee IM. Physical activity and colon cancer
prevention: a meta-analysis. Br J Cancer. 2009;100(4):611-6.
11.
Friedenreich CM, Cust AE. Physical activity and breast cancer risk: impact of timing,
type and dose of activity and population subgroup effects. Br J Sports Med. 2008;42(8):63647.
12.
Bull FC, Armstrong T, Dixon T, Ham S, al. NAe. Physical Inactivity. In: Ezzati M,
Lopez A, Rodgers A, Murray CJ, editors. Comparative Quantification of Health Risks:
Global and Regional Burden of Disease Attributable to Selected Major Risk Factors.
Switzerland: World Health Organisation; 2004. p. 729-881.
13.
Bending MW, Trueman P, Lowson KV, et al. Estimating the direct costs of bowel
cancer services provided by the National Health Service in England. Int J Technol Assess
Health Care. 2010;26(4):362-9.
14.
Maddams J, Brewster D, Gavin A, et al. Cancer prevalence in the United Kingdom:
estimates for 2008. Br J Cancer. 2009;101(3):541-7.
15.
Dolan P, Torgerson DJ, Wolstenholme J. Costs of breast cancer treatment in the
United Kingdom. Breast. 1999;8(4):205-7.
16.
British Heart Foundation. UK Coronary Heart Disease Economic Costs. Available at:
http://www.bhf.org.uk/heart-health/statistics/economic-costs-of-cvd.aspx (June 2011, date
last accessed)
17.
Department of Health. Turning the Corner: Improving Diabetes Care. Available at:
www.dh.gov.uk/en/Publicationsandstatistics/Publications/PublicationsPolicyAndGuidance/D
H_4136141. (August 2011, date last accessed)
6
7


