RLC Circuit with Cobra3
TEP
Related topics
Tuned circuit, series-tuned circuit, parallel-tuned circuit, resistance, capacitance, inductance, capacitor,
coil, phase displacement, Q-factor, band-width ,impedance, loss resistance, damping.
Principle
The impedance of parallel and series tuned circuits is investigated as a function of frequency. The Qfactor and bandwidth of the circuits are investigated. The phase displacement between current and voltage is investigated for the series tuned circuit.
Equipment
1 Cobra3 Basic Unit
2 Power supply, 12 V1 RS 232 data cable
1 Cobra3 Power Graph software
1 Cobra3 Universal writer software
1 Cobra3 Function generator module
1 Coil, 3600 turns
1 Connection box
1 PEK carbon resistor 1 W 5% 100 Ω
1 PEK carbon resistor 1 W 5% 220 Ω
1 PEK carbon resistor 1 W 5% 470 Ω
1 PEK capacitor/case 2/1 μF/ 250 V
1 PEK capacitor/case 1/2.2 μF/ 250 V
1 PEK capacitor/case 1/4.7 μF/ 250 V
2 Connecting plug
2 Connecting cord, l = 250 mm, red
1 Connecting cord, l = 250 mm, blue
2 Connecting cord, l = 500 mm, red
2 Connecting cord, l = 500 mm, blue
PC, Windows® 95 or higher
12150.00
12151.99
14602.00
14525.61
14504.61
12111.00
06516.01
06030.23
39104.63
39104.64
39104.15
39113.01
39113.02
39113.03
39170.00
07360.01
07360.04
07361.01
07361.04
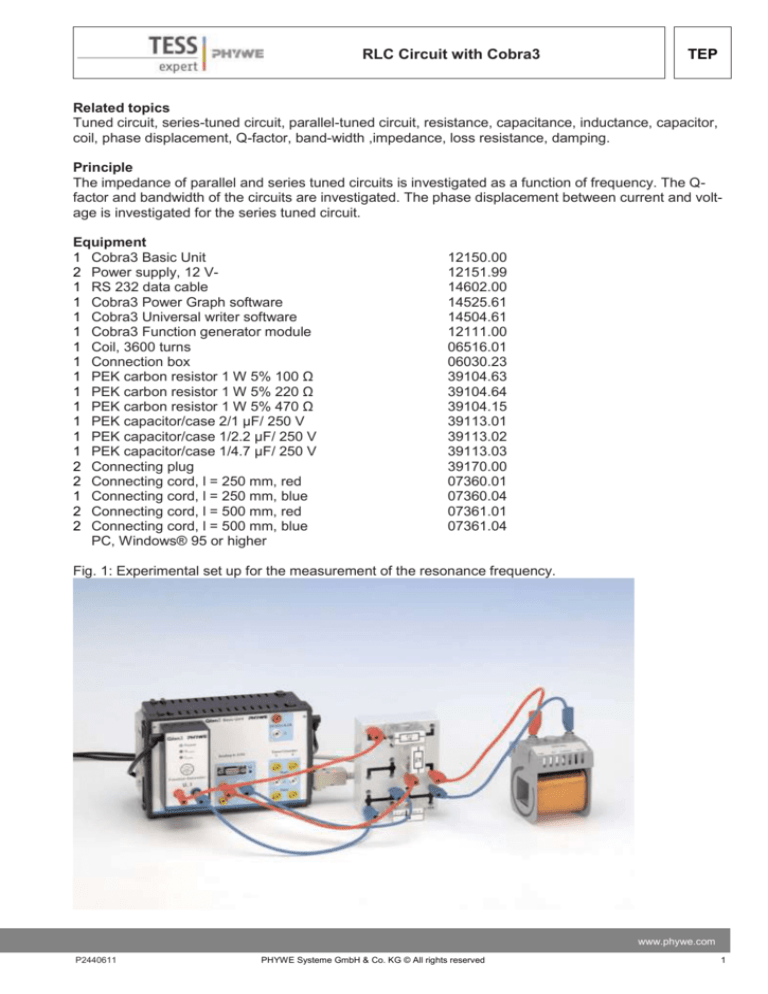
Fig. 1: Experimental set up for the measurement of the resonance frequency.
www.phywe.com
P2440611
PHYWE Systeme GmbH & Co. KG © All rights reserved
1
TEP
RLC Circuit with Cobra3
Tasks
Determine the frequency dependence of the impedance of
o a series tuned circuit with different daming resistors and different values of capacitance
o a parallel tuned circuit with different damping resistors and different values of capacitance.
Determine the Q-factor and the band-width from the obtained curves.
Determine the frequency dependence of the phase shift between current and voltage in a series
tuned circuit.
Set-up and procedure
The experimental set up is as shown in Figs. 1, 2a and 2b.
Connect the COBRA3 Basic Unit to the computer port COM1, COM2 or to USB port (for USB
computer port use USB to RS232 Converter 14602.10).
Start the "measure" program and select "Gauge" > "Cobra3 PowerGraph".
Click the "Analog In2/S2" and select the "Module /Sensor" "Burst measurement" with the parameters seen in Fig. 3.
Click the "Function Generator" symbol and set the parameters as in Fig. 4.
Add a "Virtual device" by clicking the white triangle in the upper left of the "PowerGraph" window
or by right-clicking the "Cobra3 Basic-Unit" symbol. Turn off all channels but the first and configure this one as seen in Fig. 5.
Fig. 2a: Series tuned RLC circuit.
2
PHYWE Systeme GmbH & Co. KG © All rights reserved
P2440611
RLC Circuit with Cobra3
TEP
Fig. 2b: Parallel tuned RLC circuit.
Fig. 3: Analog In 2 S2 – settings
www.phywe.com
P2440611
PHYWE Systeme GmbH & Co. KG © All rights reserved
3
TEP
RLC Circuit with Cobra3
– The "Settings" chart of PowerGraph should look like Fig. 6.
– Configure a diagram to be seen during the measurement on the "Displays" chart of PowerGraph as in
Fig. 7 and turn on some Displays for the frequency, the voltages and the current.
Fig. 4: Function Generator settings
– Set up a series tuned circuit as seen in Fig. 2a. Start a measurement with the "Continue" button. After
the measurement has stopped, the recorded curves are visible in the "measure" program main menu.
4
PHYWE Systeme GmbH & Co. KG © All rights reserved
P2440611
RLC Circuit with Cobra3
TEP
Fig. 5: Virtual device settings.
Fig. 6: "Settings" chart of PowerGraph.
www.phywe.com
P2440611
PHYWE Systeme GmbH & Co. KG © All rights reserved
5
TEP
RLC Circuit with Cobra3
Fig. 7: "Displays" chart of PowerGraph.
Record curves for 𝑅D = 0 Ω, 220 Ω, 470 Ω with the 2.2 μF capacitor.
Record curves for 𝑅D = 0 Ω with the 1 μF capacitor and the 4.7 μF capacitor.
Use "Measurement" > "Assume channel…" and "Measurement" > "Channel manager…" to display the three impedance curves with the damping resistor values 𝑅D = 0 Ω, 220 Ω, 470 Ω for the
2.2 μF capacitor in a single plot. Scale the impedance curves to the same value either using the
"Scale curves" tool with the option "set to values" or using "Measurement" > "Display options…"
filling appropriate values into the field "Displayed area" on the "Channels" chart. The result may
look like Fig. 8.
In a similar way produce a plot of the impedance over the frequency for the series tuned circuit
with no additional damping resistor and the three capacitance values 𝐶 = 1 μF, 2.2 μF, 4.7 μF.
Fig. 9 shows a possible result.
6
PHYWE Systeme GmbH & Co. KG © All rights reserved
P2440611
TEP
RLC Circuit with Cobra3
Fig. 8: Impedance in dependence on frequency for different damping resistors in a series tuned circuit.
Fig. 9: Impedance in dependence on frequency for different capacitors in a series tuned circuit.
Set up a parallel tuned circuit as in Fig. 2b.
Record curves with the 2.2 μF capacitor and different damping resistors 𝑅D = ∞ Ω, 470 Ω, 220 Ω.
Record curves with the damping resistor 𝑅D = ∞ Ω (i.e. no resistor) and 𝐶 = 1 μF, 4.7 μF.
Plot the impedance in dependence on the frequency for 𝐶 = 2.2 μF and RD = ∞ Ω, 470 Ω, 220 Ω
(Fig. 10).
Plot the impedance in dependence on the frequency for 𝐶 = 1 μF, 2.2 μF, .47 μF and 𝑅D = ∞ Ω
(Fig. 11).
www.phywe.com
P2440611
PHYWE Systeme GmbH & Co. KG © All rights reserved
7
TEP
RLC Circuit with Cobra3
Fig. 10: Impedance in dependence on frequency for different resistor in a parallel tuned circuit.
Fig. 11: Impedance in dependence on frequency for different capacitors in a parallel tuned circuit.
8
PHYWE Systeme GmbH & Co. KG © All rights reserved
P2440611
RLC Circuit with Cobra3
TEP
Set up a series tuned circuit as seen in Fig. 2a with 𝑅D = 0 Ω and 𝐶 = 2.2 μF.
Select "Gauge" > "Cobra3 Universal Writer" and select the parameters as seen in Fig. 12.
Record current and voltage curves in dependence on time for different frequencies between 80 z
and 360 Hz. For frequencies over 200 Hz it is necessary to switch the frequency range under
"Configure FG module" to "High frequencies".
Note which of the curves, current or voltage was ahead of the other.
Use "Analysis" > "Smooth…" with the options "left axis" and "add new" on both current and voltage curves. The curve that was clicked on before will be processed.
Use "Measurement" > "Channel manager…" to select the "Current FG' "values as x-axis and the
"Analog in 2' "-voltage values as y-axis (Fig. 13). The Lissajous-figure to be produced now is no
function but a relation so select in the "Convert relation to function" window the option "Keep
measurement in relation mode".
Use the "Survey" tool to determine the maximal extension of the Lissajous-figure in x-direction
∆𝐼max (Fig. 14) and the extension of the figure on the y = 0 line ∆𝐼0 (Fig. 15).
The ratio ∆𝐼0 / ∆𝐼max equals the sine of the phase shift angle sin(𝜑) between current and voltage.
Calculate 𝜑 and tan(𝜑) for the used frequencies and plot them over the frequency using "Measurement" > "Enter data manually…" (Fig. 16).
You may use "Measurement" > "Function generator…" to compare calculated theoretical values
with the measured values. Fig. 17 shows the equation for coil with 𝐿 =0.3 mH and d.c. resistance
𝑅L = 150 Ω in series with a 2.2 μF capacitor with no additional damping resistor
Fig. 12: Universal Writer settings.
www.phywe.com
P2440611
PHYWE Systeme GmbH & Co. KG © All rights reserved
9
TEP
RLC Circuit with Cobra3
Fig. 13: Channel manager.
Theory and evaluation
– Series tuned circuit
A coil with inductance 𝐿 and ohmic resistance 𝑅L , a capacitance C and an ohmic resistance 𝑅D are connected in series to an alternating voltage source
̂ ∙ 𝑒 𝑖𝜔𝑡
𝑈(𝑡) = 𝑈
with the angular frequency 𝜔 = 2 𝜋 𝑓 . The ohmic resistances add up to a total ohmic resistance =
𝑅L + 𝑅D . Inductance 𝐿 and ohmic resistance 𝑅L of the coil are in series because all the current going
through the coil is affected by the ohmic resistance of the long coil wire. Though Lenz's rule states 𝑈L =
−𝐿 · d𝐼/d𝑡, here the polarity of the voltage on the coil has to be included as positive, because if a voltage is switched on an ideal coil, the induced voltage on the coil is such, that the positive pole of the coil
is there, where it is connected to the positive pole of the voltage source.
Fig. 14: Determining ∆𝐼max on the Lissajous-figure displaying the phase shift between current and voltage tuned circuit.
10
PHYWE Systeme GmbH & Co. KG © All rights reserved
P2440611
RLC Circuit with Cobra3
TEP
Fig. 15: Determining ∆𝐼0 on the Lissajous-figure displaying the phase shift between current and voltage.
So Kirchhoff's voltage law becomes
𝑈(𝑡) = 𝐼(𝑡) ∙ 𝑅 + 𝐿𝐼 (̇ 𝑡) +
1
𝐶
𝑄(𝑡)
(1)
with the current 𝐼(𝑡) and the charge on the capacitor 𝑄(𝑡). With
𝐼(𝑡) = 𝑄̇ (𝑡),
differentiating (1) yields
𝑈̇ =
1
𝐶
𝐼 + 𝑅𝐼 ̇ + 𝐿𝐼 ̈
(2).
̂ ∙ 𝑒 𝑖𝜔𝑡 and the approach
With 𝑈̇ = 𝑖𝜔𝑈
𝐼 = 𝑒 −𝑖𝜑 𝐼̂ 𝑒 𝑖𝜔𝑡 , 𝐼 ̇ = 𝑖𝜔𝑒 −𝑖𝜑 𝐼̂ 𝑒 𝑖𝜔𝑡 , 𝐼 ̈ = −𝜔2 𝑒 −𝑖𝜑 𝐼̂ 𝑒 𝑖𝜔𝑡
and the impedance 𝑍 =
̂
𝑈
𝐼̂
equation(2) becomes
1
𝐶
𝑖𝜔𝑍 = 𝑒 −𝑖𝜑 ( + 𝑖𝜔𝑅 − 𝜔2 𝐿)
|𝑍| = √𝑅 2 + (𝜔𝐿 −
1 2
)
𝜔𝐶
(3).
.
So the impedance of the circuit becomes infinite for low frequencies – the capacitor blocks all d.c. current. For low frequencies the capacitor dominates the behaviour of the circuit.
The impedance has a minimum for
www.phywe.com
P2440611
11
PHYWE Systeme GmbH & Co. KG © All rights reserved
TEP
𝜔0 𝐿 =
RLC Circuit with Cobra3
1
𝜔0 𝐶
thus 𝜔0 =
1
√𝐿𝐶
,
where only the pure ohmic resistance comes to effect. For high frequencies the high coil's impedance
prevails. The series tuned circuit is a bandpass filter that has a low impedance only for the frequencies
around its resonance frequency 𝜔0 .
Fig. 16: Phase shift angle and tangent of phase shift angle between current and voltage on a series
tuned circuit.
Using 𝑒 −𝑖𝜑 = cos 𝜑 − 𝑖 sin 𝜑 and splitting (3) into real and imaginary part yields for the imaginary part
(since Z is real):
1
) cos 𝜑
𝜔𝐶
𝑖 (𝜔𝐿 −
𝜔𝐿−
tan 𝜑 =
− 𝑖𝑅 sin 𝜑 = 0,
1
𝜔𝐶
(4)
𝑅
This term is negative for low frequencies – i.e. the exponent of the current function 𝑒 𝑖(𝜔𝑡− 𝜑) has a higher
value than the one for the voltage function 𝑒 𝑖𝜔𝑡 . This means the current is ahead of the voltage for low
frequencies and behind the voltage for high frequencies.
For the series tuned circuit the quality factor 𝑄𝑠 is defined as
𝑄𝑠 =
1
𝑅
𝐿
√ .
𝐶
The quality factor determines the bandwidth of the circuit 𝛥𝜔 = 𝜔2 – 𝜔1 with
𝑄𝑠 =
12
𝜔0
𝛥𝜔
=
𝑓0
𝛥𝑓
and 𝑍(𝜔1,2 ) = √2 ∙ 𝑅.
PHYWE Systeme GmbH & Co. KG © All rights reserved
P2440611
TEP
RLC Circuit with Cobra3
and . The resonance frequency is the geometric mean value of the frequencies 𝜔2 and 𝜔1 :
𝜔0 = √𝜔1 ∙ 𝜔2 = 1⁄√𝐿𝐶
In the measurement data of Fig. 8 and Fig. 9 the quality factor can be determined with the "Survey" tool
of "measure". The measured resistance value includes the ohmic resistance of the coil and is about that
amount greater than the nominal 𝑅D . A digital multimeter measured the coil's d.c. resistance to
132 Ω.
– Parallel tuned circuit
The correct calculation for the circuit of Fig. 2b is more complicated since there is a relevant ohmic resistance both parallel and in series to the inductance. The calculation is left out here but can be carried
out in the same manner as above using now both Kirchhoff's current and Kirchhoff's voltage rule.
The resonance frequency is for low RL again
𝜔0 =
1
√𝐿𝐶
.
Here the impedance is maximal for the resonance frequency. Below it the coil acts as a shortcut and at
zero frequency the impedance curve starts at the d.c. resistance of the coil, if no damping resistor is
connected (𝑅D = ∞ Ω). For high frequencies the capacitor acts as a shortcut and the impedance goes
to zero for 𝑓 ⟶ .
For low 𝑅L : The quality factor 𝑄P for the parallel tuned circuit is defined as
𝐶
𝑄𝑃 = 𝑅D √
𝐿
again with 𝛥𝜔 = 𝜔2 – 𝜔1 and 𝑄𝑃 =
𝑍(𝜔1,2 ) =
1
√2
𝜔0
∆𝜔
=
𝑓0
,
∆𝑓
but here
𝑍(𝜔0 ), 𝜔0 = √𝜔1 ∙ 𝜔2 = 1⁄√𝐿𝐶
Note
The 100 Ω resistor is in the circuit to minimize possible interferences between the parallel tuned circuit
and the function generator module output.
Fig. 17: "Equation" chart of the Function generator.
www.phywe.com
P2440611
13
PHYWE Systeme GmbH & Co. KG © All rights reserved
TEP
RLC Circuit with Cobra3
Table 1: Series tuned circuit with coil with nominal 0.3 mH and 𝑅L = 150 Ω
14
PHYWE Systeme GmbH & Co. KG © All rights reserved
P2440611


![Sample_hold[1]](http://s2.studylib.net/store/data/005360237_1-66a09447be9ffd6ace4f3f67c2fef5c7-300x300.png)