Appendix II: Principal components analysis of ant morphological
advertisement
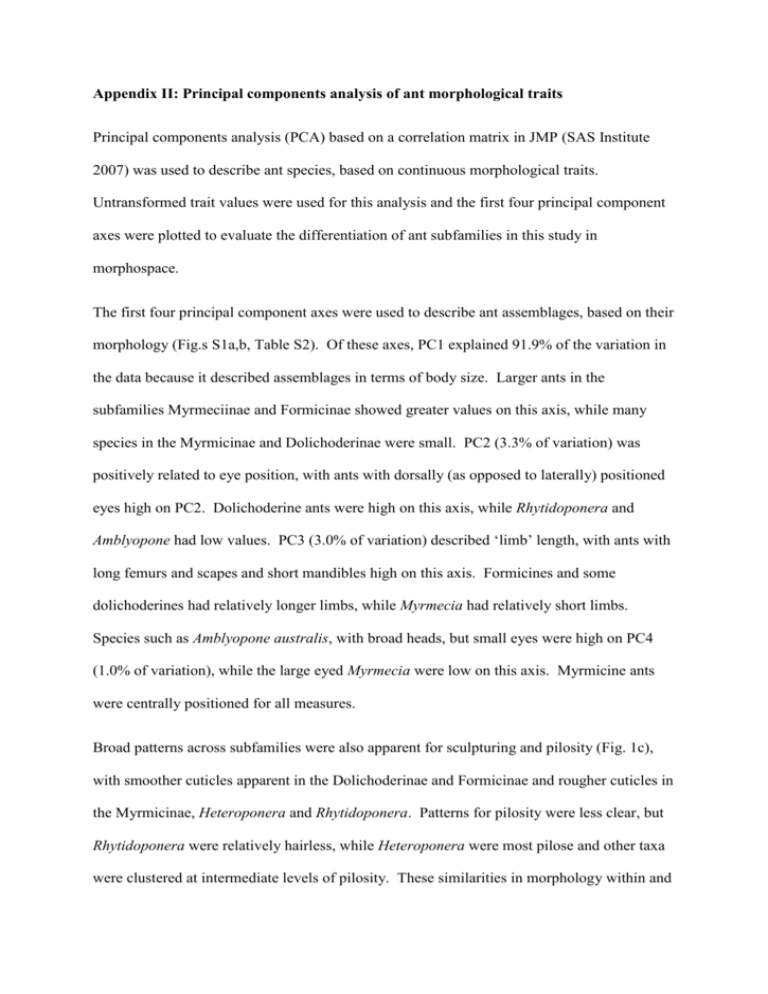
Appendix II: Principal components analysis of ant morphological traits Principal components analysis (PCA) based on a correlation matrix in JMP (SAS Institute 2007) was used to describe ant species, based on continuous morphological traits. Untransformed trait values were used for this analysis and the first four principal component axes were plotted to evaluate the differentiation of ant subfamilies in this study in morphospace. The first four principal component axes were used to describe ant assemblages, based on their morphology (Fig.s S1a,b, Table S2). Of these axes, PC1 explained 91.9% of the variation in the data because it described assemblages in terms of body size. Larger ants in the subfamilies Myrmeciinae and Formicinae showed greater values on this axis, while many species in the Myrmicinae and Dolichoderinae were small. PC2 (3.3% of variation) was positively related to eye position, with ants with dorsally (as opposed to laterally) positioned eyes high on PC2. Dolichoderine ants were high on this axis, while Rhytidoponera and Amblyopone had low values. PC3 (3.0% of variation) described ‘limb’ length, with ants with long femurs and scapes and short mandibles high on this axis. Formicines and some dolichoderines had relatively longer limbs, while Myrmecia had relatively short limbs. Species such as Amblyopone australis, with broad heads, but small eyes were high on PC4 (1.0% of variation), while the large eyed Myrmecia were low on this axis. Myrmicine ants were centrally positioned for all measures. Broad patterns across subfamilies were also apparent for sculpturing and pilosity (Fig. 1c), with smoother cuticles apparent in the Dolichoderinae and Formicinae and rougher cuticles in the Myrmicinae, Heteroponera and Rhytidoponera. Patterns for pilosity were less clear, but Rhytidoponera were relatively hairless, while Heteroponera were most pilose and other taxa were clustered at intermediate levels of pilosity. These similarities in morphology within and differences among subfamilies suggest a strong possibility for phylogenetic relatedness to drive trait associations, which we considered by using both phylogenetically adjusted and unadjusted regressions. Table S1: Principal components axes for continuous traits. All values were residuals on the regression with Weber’s length. Values greater than 0.3 are presented in bold and are interpreted as having meaningful contributions to the axes. Trait Weber's length Femur length Head width Mandible length Eye width Eye position Scape length PC1 0.39 0.39 0.38 0.37 0.38 0.35 0.37 PC2 -0.16 -0.16 -0.20 -0.07 0.04 0.90 -0.28 PC3 0.01 0.36 -0.28 -0.62 -0.20 0.15 0.59 PC4 0.20 -0.06 0.68 -0.20 -0.64 0.15 -0.12 Figure S1: Principal components analysis of continuous morphological traits of pitfall-trapped ants in grassy woodlands, showing the distribution of subfamilies: a) PC1 vs PC2; b) PC3 vs PC4; and c) mean ± SE pilosity and sculpturing for subfamilies. Trait contributions to PCA axes are shown in Table 2. Large ants are positioned high on PC1; ants with eyes positioned dorsally (rather than laterally) are high on PC2; ants with long ‘limbs’ (femurs and scapes) and short mandibles are high on PC3; species with broad heads, but small eyes are high on PC4. a) 2 Amblyoponinae Cerapachinae Dolichoderinae Ectatomminae Formicinae Heteroponerinae Myrmeciinae Myrmicinae Ponerinae c) 3.5 b) 1 3 0.5 0 -1 2.5 Sculpturing PC4 PC2 1 0 2 1.5 1 -0.5 0.5 -2 -1 -4 1 6 PC1 11 0 -2 -1 0 PC3 1 2 0 1 Pilosity 2 3
