gbi12166-sup-0001-Supinfo
advertisement
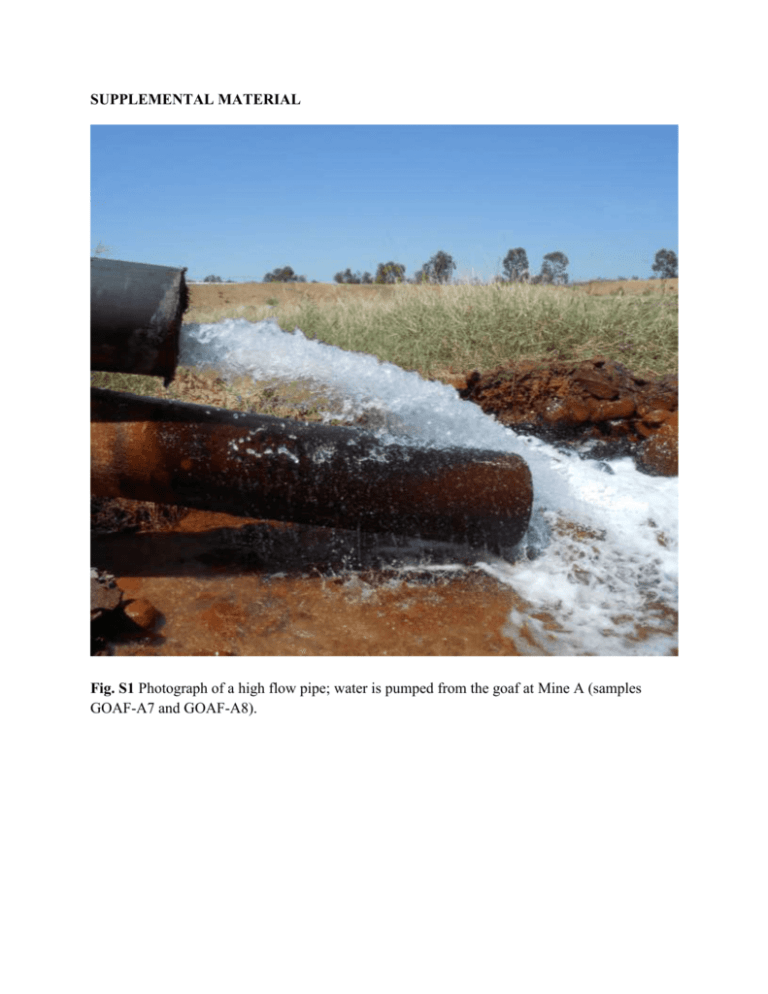
SUPPLEMENTAL MATERIAL Fig. S1 Photograph of a high flow pipe; water is pumped from the goaf at Mine A (samples GOAF-A7 and GOAF-A8). Fig. S2 a) Photograph of a mine slime (taken using a spark-free camera) where water is flowing through the coal wall in Mine A (sample CWB-A3). Note the iron staining of the rock dust, which is applied to the coal mine wall. Fig. S3 Rarefaction analysis of 16S rRNA gene amplicon libraries from Bowen Basin coal mine samples. Table S1 Number of sequences and diversity index values for 16S rRNA amplicon gene libraries from Bowen Basin mine samples Sample ID FW-B5 CWB-A3 CWB-A6 CWB-B3 MMW-B4 GOAF-A7 GOAF-A8 Total unique reads 2035 5494 2095 7704 4947 2381 3158 Da 0.3533 0.0124 0.0046 0.0138 0.0065 0.1151 0.0153 1/D 2.8 80.5 217.0 72.5 153.3 8.7 65.3 Hˊa 1.5 5.6 6.1 5.6 6.3 3.4 5.3 D is the Simpson’s diversity value. Hˊ is the Shannon index value. All diversity indices were calculated after subsampling libraries to 2035 OTU, which allowed for a more appropriate comparison of groups (Gihring et al., 2012). a Fig. S4. A principle components analysis of the coal mine libraries. Red numbers indicate OTU. The source (r2 = 0.5440 P=0.05) where samples are divided into waters collected from piped environments compared to the coal wall samples. P values are based on 999 permutations. Fig. S5 A principle components analysis of the coal mine libraries with geochemical data. Red numbers indicate OTU. Microbial community variance and geochemistry is associated for pH (r2 = 0.9099 P=0.03), Mg (r2 = 0.857 P=0.05), Ca (r2 = 0.8783 P=0.03) and K (r2 = 0.8762 P=0.04) but not for the other geochemical parameters listed in Table 2. P values are based on 999 permutations. Growth of microbial cultures All biological samples for culturing were collected at the mine site in sterile Falcon tubes without a gas headspace and stored at 4°C for transport. Microbial cultures were grown on a simple salt mixture (based on the mine geochemistry) and processed coal from the Mine B coal pile. The minimal salts solution was based on the geochemistry of coal mine formation water (FW-B2; Table 2) and contained (per L): 2.5293 g NaCl, 0.4216 g NaHCO3, 0.1980 g MgSO4•7H2O, 0.0477 g CaCl2•2H2O, 0.0666 g NH4Cl, 0.0076 g KCl, and 0.0031 g NaF. Anaerobic cultures were grown in 10 ml crimp top vials containing 0.25 g of coal (dried and sieved between 350 and 150 µm) and 4.5 ml of minimal salts solution. The media was reduced by bubbling with 100% N2(g) and was dispensed in an anaerobic chamber with an atmosphere of 97% N2 and 3% H2 (COY Laboratory Products Inc., Ann Arbor, MI). Vials were inoculated with 0.5 ml of field sample, including coal fines, and grown for at least 4 weeks in the dark at room temperature, without shaking. The presence of aerobic methanotrophs was tested in CWB-B3 by growing cultures in crimp top vial containing 4.5 ml of minimal salts solution, atmospheric headspace (21% O2) and a 0.5%(vol./vol.) methane supplement. The presence of methanogenesis was indicated by a methane concentration in the vial being at least 50% greater than baseline methane desorbed from the coal. The presence of methanotrophy was confirmed by a decrease in methane to below the detection limit. Methane was measured using a Shimadzu 2014 gas chromatography (Shimadzu, Japan) with a Shincarbon micropack column (no. 19808; Restek) and flame ionisation detector (GC-FID). References Gihring TM, Green SJ, Schadt CW (2012) Massively parallel rRNA gene sequencing exacerbates the potential for biased community diversity comparisons due to variable library sizes. Environmental Microbiology, 14, 285-290.

