Minutes (m) f
advertisement

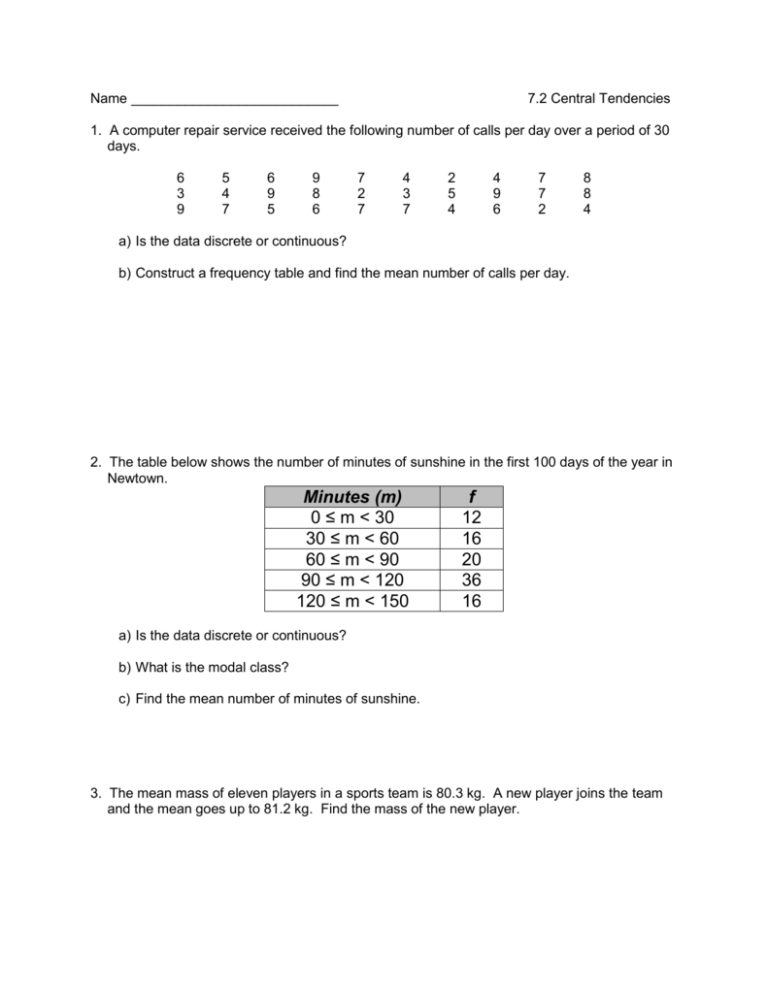
Name ___________________________ 7.2 Central Tendencies 1. A computer repair service received the following number of calls per day over a period of 30 days. 6 3 9 5 4 7 6 9 5 9 8 6 7 2 7 4 3 7 2 5 4 4 9 6 7 7 2 8 8 4 a) Is the data discrete or continuous? b) Construct a frequency table and find the mean number of calls per day. 2. The table below shows the number of minutes of sunshine in the first 100 days of the year in Newtown. Minutes (m) 0 ≤ m < 30 30 ≤ m < 60 60 ≤ m < 90 90 ≤ m < 120 120 ≤ m < 150 f 12 16 20 36 16 a) Is the data discrete or continuous? b) What is the modal class? c) Find the mean number of minutes of sunshine. 3. The mean mass of eleven players in a sports team is 80.3 kg. A new player joins the team and the mean goes up to 81.2 kg. Find the mass of the new player. 4. The Robinson family must drive an average of 250km per day to complete their vacation on time. On the first five days, they travel 220km, 300km, 210km, 275km and 240km. How many km must they travel on the sixth day in order to finish their vacation on time? 5. Billy’s mean sales price for 12 computers is $310 and Jean sold 13 with a mean of $320. Their boss tells them to combine their sales at the end of the week. What is the mean after Billy and Jean combine their sales? 6. A frequency table for the heights of a basketball squad is given below. Height (cm) 170 – 175 – 180 – 185 – 190 – 195 – 200 - < 205 Frequency 1 8 9 11 9 3 3 a) Explain why ‘height’ is a continuous variable. b) Construct a histogram for the data. The axes should be carefully marked and labeled and include a heading for the graph. c) What is the modal class? Explain what this means. d) Describe the distribution of the data. 7. The frequency column graph alongside gives the value of donations for the Heart Foundation collected in a particular street. a) Construct a frequency table from the graph. b) Determine the total number of donations. c) For the donations find the: i. Mean ii. Median iii. Mode d) Which of the measures of central tendency can be found easily using the graph only?


