The SYNTAX Trial at 3 Years - JACC: Cardiovascular Interventions
advertisement
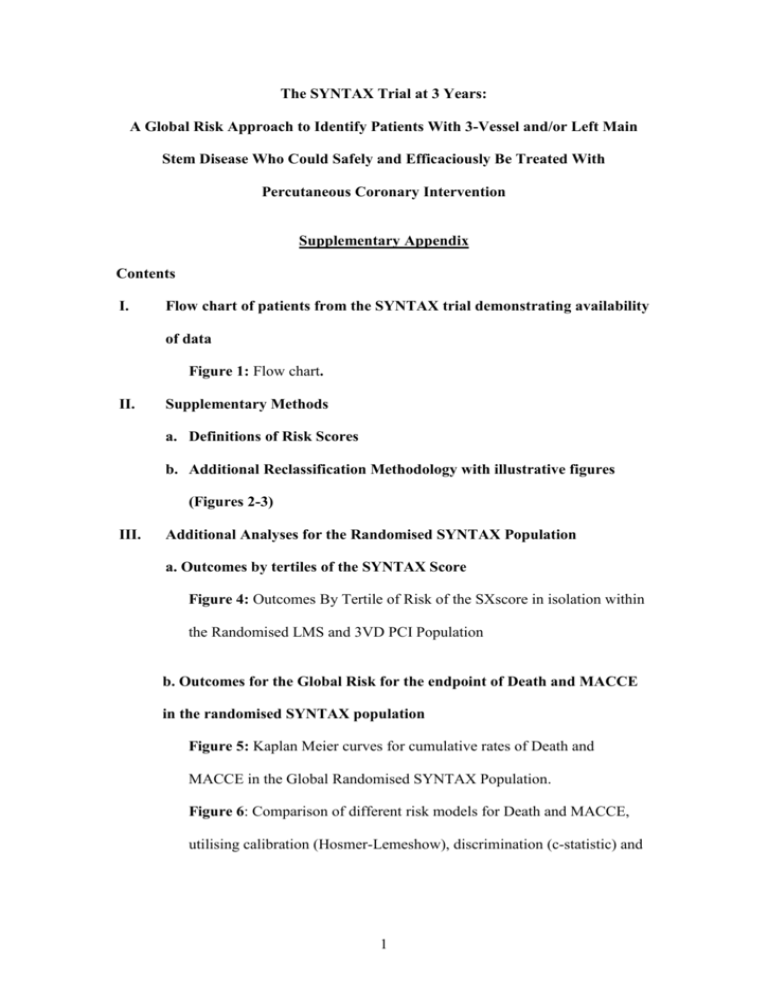
The SYNTAX Trial at 3 Years: A Global Risk Approach to Identify Patients With 3-Vessel and/or Left Main Stem Disease Who Could Safely and Efficaciously Be Treated With Percutaneous Coronary Intervention Supplementary Appendix Contents I. Flow chart of patients from the SYNTAX trial demonstrating availability of data Figure 1: Flow chart. II. Supplementary Methods a. Definitions of Risk Scores b. Additional Reclassification Methodology with illustrative figures (Figures 2-3) III. Additional Analyses for the Randomised SYNTAX Population a. Outcomes by tertiles of the SYNTAX Score Figure 4: Outcomes By Tertile of Risk of the SXscore in isolation within the Randomised LMS and 3VD PCI Population b. Outcomes for the Global Risk for the endpoint of Death and MACCE in the randomised SYNTAX population Figure 5: Kaplan Meier curves for cumulative rates of Death and MACCE in the Global Randomised SYNTAX Population. Figure 6: Comparison of different risk models for Death and MACCE, utilising calibration (Hosmer-Lemeshow), discrimination (c-statistic) and 1 overall model performances (Brier score) in the Global Randomised SYNTAX Population. Tables 1-3: Comparisons (CABG and PCI) of low Global Risk Groups (GRCLOW) in the Global, LMS and 3VD Randomised SYNTAX Populations. c. Outcomes for the Global Risk for the endpoint Death/MI/Stroke in the Randomised SYNTAX population Figure 7: Kaplan Meier curves for cumulative rates of Death/MI/Stroke in the Randomised LMS population Figure 8: Kaplan Meier curves for cumulative rates of Death/MI/Stroke in the Randomised LMS population IV. Additional Comparative Analyses for the GRCINT and GRCHIGH groups in the Randomised SYNTAX Populations Tables 4-6: Comparisons (CABG and PCI) for the intermediate Global Risk Groups (GRCINT) Tables 7-9: Comparisons (CABG and PCI) for the high Global Risk Groups (GRCHIGH) V. Reclassification Analyses for Randomised SYNTAX Population Tables 10-11: Reclassification Analyses VI. Additional Analyses for the ‘All-Comers’ SYNTAX Population Figure 9: Kaplan Meier curves for cumulative rates of Death and MACCE in the Global ‘All-Comers’ SYNTAX Population. Figures 10-11: Comparison of different risk models for Death and MACCE, utilising calibration (Hosmer-Lemeshow), discrimination (c- 2 statistic) and overall model performances (Brier score) in the Global ‘AllComers’ SYNTAX Population. Tables 12-14: Comparisons (CABG and PCI) of low Global Risk Groups (GRCLOW) in the Global, LMS and 3VD ‘All-Comers’ SYNTAX Populations. VII. Reclassification Analyses for “All-Comers’ SYNTAX Population Tables 15-16: Reclassification Analyses VIII. Additional Material: Figure 12: Vessel Distribution in the LMS Population According to SYNTAX Score Tertiles. IX. Additional References 3 I. Flow chart of patients from the SYNTAX trial demonstrating availability of data . Based on the original study protocol (1,29) 649 of the 1077 CABG nested registry patients were randomly allocated for follow up; data from 37 patients were unavailable (11 patients at baseline and a further 26 patients at follow up). Figure 1. Flow chart. 4 II. Supplementary Methods a) Definitions of Risk Scores SYNTAX Score (1-4) The SYNTAX Score Algorithm. (http://www.syntaxscore.com) The following algorithm is applied to each individual coronary lesion that has a diameter stenosis greater than 50% and located in a vessel that is larger than 1.5 mm in diameter – the individual lesion scores are added together to give the final SYNTAX score. The Syntax Score Algorithm 1. Arterial dominance 2. Arterial segments involved per lesion Lesion characteristics 3. Total occlusion i. Number of segments involved ii. Age of the total occlusion (>3 months) iii. Blunt stump iv. Bridging collaterals v. First segment beyond the occlusion visible by antegrade or retrograde filling vi. Side branch involvement 4. Trifurcation i. Number of segments diseased 5. Bifurcation i. Medina type ii. Angulation between the distal main vessel and the side branch <70° 6. Aorto-ostial lesion 7. Severe tortuosity 8. Length >20 mm 9. Heavy calcification 10. Thrombus 11. Diffuse disease/small vessels i. Number of segments with diffuse disease/small vessels 5 ACEF Score (5-7) The ACEF score is calculated using the formula: ACEF= [Age/Ejection fraction (%)] + [1 (if creatinine >2mg/dl)]. The left ventricular ejection fraction (LVEF) is the value recorded prior to the index PCI procedure, and in the event of multiple available values, the lowest recorded figure. The serum creatinine value is the value recorded prior to the index PCI. Clinical SYNTAX score (8) The Clinical SYNTAX Score is calculated using the formula: Clinical SYNTAX Score = [SXscore] x [modified ACEF score]. The modified ACEF score is calculated using the formula: age/ejection fraction+1 point for every 10ml/min reduction in creatinine clearance below 60ml/min/1.73m2 (up to a maximum of 6 points). The LVEF is the value recorded prior to the index PCI and in the event of multiple available values the lowest recorded figure. Creatinine clearance is calculated using the Cockcroft-Gault equation using the patient’s age, weight, and serum creatinine values recorded prior to the index PCI. (9) Additive EuroSCORE (10) The additive EuroSCORE is calculated by summation of the individual scores from 17 different clinical variables. Additive EuroSCORE Patient Factors Age Sex Chronic pulmonary disease Peripheral arteriopathy Neurological dysfunction Previous cardiac surgery Serum creatinine Per 5 years or part thereof over the age of 60 years Female Long-term use of bronchodilators or steroids for respiratory disease Claudication/carotid stenosis >50%/Previous or planned intervention on the abdominal aorta, limb arteries, or carotids Severely affected mobility or day-to-day function Previous opening of the pericardium Pre-operatively >200 µmol/l 6 1 1 1 2 2 3 2 Active endocarditis Critical pre-operative state Cardiac factors Unstable angina Left ventricular function Recent MI Pulmonary hypertension Operative factors Emergency Operation Other than isolated CABG Surgery on thoracic aorta Post-infarct septal rupture Antibiotic therapy at time of surgery Pre-operative cardiac arrest, ventilation, renal failure, inotropic support, intra-aortic balloon pump use, ventricular arrhythmia 3 3 Rest pain requiring IV nitrates Moderate (30%–50%) Poor (<30%) Within 90 days Systolic pulmonary artery pressure >60 mm Hg 2 1 3 2 2 Performed before the start of next working day Major cardiac procedure other than or in addition to CABG 2 2 3 4 Logistic EuroSCORE (11) The logistic EuroSCORE utilises the EuroSCORE logistic regression equation and uses the same risk factors as the additive EuroSCORE. b) Additional Reclassification Methodology The SXscore and additive EuroSCORE consists of 3 categories of level of anatomical disease complexity (2-4) and clinical risk (10,11) respectively. By combining the two categorical based scores to form the Global Risk (GRC) 9 different risk groups were created. Based on the principle that comparable clinical outcomes, in patients with a low SXscore undergoing CABG or PCI, were evident at 3 years (1,12) it was hypothesised that patients without a high EuroSCORE and/or high SXscore would be a lower risk population (GRCLOW) population, who would be equally amenable to CABG or PCI in terms of efficacy and safety. 7 The underlying principles of the reclassification analyses were therefore to ensure that – in the higher anatomical risk patients (i.e. with intermediate SXscores and lowintermediate EuroSCORE) reclassified as low Global Risk (GRCLOW) – comparability (or more favourable PCI outcomes) in clinical outcomes between CABG and PCI would be maintained in this reclassified group. Conversely – in the lower anatomical risk patients with a high clinical comorbidity (i.e. low SXscore with a high EuroSCORE) reclassified as a higher Global Risk (GRCINT) – more favourable surgical clinical outcomes would be evident in this reclassified group. If reclassification analyses were not undertaken the main danger would be that higher (or lower risk) patients would be inappropriately reclassified to lower (or higher) risk groups. This may subsequently not be clinically apparent as the expected lower (or higher) clinical outcomes within the population the reclassified patients entered, would potentially dilute the clinical outcomes within the reclassified patients. Consequently, comparisons of clinical outcomes (between CABG and PCI) within the reclassified groups are required to ensure that the patients have been appropriately reclassified. Illustrative figures explaining these concepts are detailed below (Figures 1-2). 8 Figure 2: Comparability (or more favourable PCI outcomes) in Death and MACCE between CABG and PCI for the higher risk group (intermediate SXscore and lowintermediate EuroSCOREs) reclassified to a lower risk (GRCLOW) group would be expected. Figure 3: More favourable clinical outcomes (Death or MACCE) would be expected with CABG compared to PCI, for the lower risk group (low SXscore and high EuroSCORE) reclassified to a higher (GRCINT) risk group. This is in keeping with previous findings of a high EuroSCORE to be an independent predictor of in-hospital mortality and MACCE after PCI. (13-16) 9 III Additional Analyses for the Randomised SYNTAX Population a. Outcomes by tertiles of the SYNTAX Score Figure 4 At 36-months within both the LMS and 3VD PCI cohorts, a low SXscore group could not be differentiated from the higher risk groups (low-intermediate SXscore) for Death and MACCE. Within the LMS PCI population a high SXscore group could only be differentiated from the lower SXscore groups (low to intermediate SXscore) for Death and MACCE. Title: Outcomes By Tertile of Risk of the SXscore in isolation within the Randomised LMS and 3VD PCI Population Caption: Kaplan Meier curves for cumulative rate of Death (upper) and MACCE (lower) at 3-year follow-up, stratified to tertile of the SXscore, event rate ±1.5 SE. SXscore: LMS Death - PCI SXscore: 3VD Death- PCI SXscore: LMS MACCE - PCI SXscore: 3VD MACCE - PCI 10 b. Outcomes for the Global Risk for the endpoint of Death and MACCE in the randomised SYNTAX population Figure 5: Kaplan Meier curves for cumulative rates of Death (upper), and MACCE (lower) in the Global Randomised SYNTAX population at 3-year follow-up stratified according to the group of Global Risk, event rate ±1.5 SE. RANDOMISED DEATH - PCI RANDOMISED DEATH - CABG RANDOMISED MACCE - PCI RANDOMISED MACCE - CABG 11 Figure 6: Comparison of different risk models for the Global Randomised SYNTAX population for Death (left) and MACCE (right), utilising calibration (HosmerLemeshow), discrimination (c-statistic) and overall model performances (Brier score). (17) GLOBAL RANDOMISED SYNTAX POPULATION – 3-YEAR DEATH GLOBAL RANDOMISED SYNTAX POPULATION – 3-YEAR MACCE 12 Tables 1-3: Comparisons (CABG and PCI) of low Global Risk Groups (GRCLOW) Table 1 Principal effectiveness and safety results, summary of time-to-event analyses intentto-treat, comparing low Global Risk groups (GRCLOW) for the Global Randomised PCI and Global Randomised CABG population (N=921). Event 3 Year Post-Allocation MACCE Death/Stroke/MI, Any Death, Any Cerebrovascular Event (Stroke), Any MI, Any Revascularisation, Any PCI CABG Post-Procedure Stent Thrombosis/Graft Occlusion CABG (N=443) PCI (N=478) Hazard Ratio [95% CI] Difference p-Value 20.4% (86) 11.2% (47) 6.0% (25) 21.6% (102) 8.5% (40) 4.2% (20) 1.06 [0.80, 1.41] 0.74 [0.49, 1.14] 0.70 [0.39, 1.26] 1.2% -2.7% -1.8% 0.69 0.17 0.24 3.1% (13) 1.1% (5) 0.34 [0.12, 0.95] -2.0% 0.031 3.1% (13) 12.0% (49) 11.3% (46) 1.2% (5) 4.9% (23) 16.5% (77) 14.2% (66) 3.7% (17) 1.58 [0.80, 3.12] 1.43 [1.00, 2.04] 1.30 [0.89, 1.89] 3.04 [1.12, 8.23] 1.8% 4.6% 2.9% 2.5% 0.18 0.050 0.17 0.02 3.9% (16) 3.9% (18) 0.99 [0.51, 1.95] 0.0% 0.99 Table 2 Principal effectiveness and safety results, summary of time-to-event analyses intentto-treat, comparing GRCLOW for the Global Randomised LMS population (N=318). CABG (N=152) PCI (N=166) Hazard Ratio [95% CI] Difference p-Value Post-Allocation MACCE Death/Stroke/MI, Any Death, Any Stroke, Any MI, Any Revascularisation, Any 23.1% (34) 12.3% (18) 7.5% (11) 3.5% (5) 1.4% (2) 14.6% (21) 15.8% (26) 5.5% (9) 1.2% (2) 0.6% (1) 3.7% (6) 12.8% (21) 0.64 [0.39, 1.07] 0.42 [0.19, 0.94] 0.16 [0.03, 0.70] 0.17 [0.02, 1.46] 2.59 [0.52, 12.82] 0.85 [0.46, 1.56] -7.3% -6.8% -6.3% -2.9% 2.3% -1.8% 0.088 0.029 0.0054 0.067 0.23 0.60 PCI CABG Post-Procedure Stent Thrombosis/Graft Occlusion 13.3% (19) 1.3% (2) 10.9% (18) 3.0% (5) 0.81 [0.42, 1.54] 2.20 [0.43, 11.36] -2.3% 1.7% 0.51 0.33 4.1% (6) 2.5% (4) 0.57 [0.16, 2.01] -1.6% 0.37 Event 3 Year 13 Table 3 Principal effectiveness and safety results, summary of time-to-event analyses intentto-treat, comparing GRCLOW for Global Randomised 3VD population (N=603). CABG (N=291) PCI (N=312) Hazard Ratio [95% CI] Difference p-Value Post-Allocation MACCE Death/Stroke/MI, Any Death, Any Stroke, Any MI, Any Revascularisation, Any 19.0% (52) 10.6% (29) 5.2% (14) 2.9% (8) 4.0% (11) 10.5% (28) 24.7% (76) 10.0% (31) 5.8% (18) 1.3% (4) 5.6% (17) 18.5% (56) 1.35 [0.95, 1.92] 0.95 [0.57, 1.58] 1.14 [0.57, 2.30] 0.45 [0.13, 1.49] 1.40 [0.66, 2.99] 1.88 [1.19, 2.96] 5.7% -0.5% 0.7% -1.6% 1.6% 8.0% 0.10 0.85 0.71 0.18 0.38 0.0055 PCI CABG Post-Procedure Stent Thrombosis/Graft Occlusion 10.2% (27) 1.1% (3) 15.9% (48) 4.0% (12) 1.66 [1.04, 2.66] 3.60 [1.02, 12.75] 5.7% 2.9% 0.033 0.034 3.7% (10) 4.6% (14) 1.25 [0.56, 2.81] 0.9% 0.59 Event 3 Year 14 c. Outcomes for the Global Risk for the endpoint Death/MI/Stroke in the Randomised SYNTAX population Figure 7: Kaplan Meier curves for cumulative rates of Death/MI/Stroke in the Randomised LMS SYNTAX population at 3-year follow-up stratified according to the group of Global Risk, event rate ±1.5 SE. RANDOMISED DEATH/MI/STROKE - PCI RANDOMISED DEATH/MI/STROKE - CABG Figure 8: Kaplan Meier curves for cumulative rates of Death/MI/Stroke in the Randomised 3VD SYNTAX population at 3-year follow-up stratified according to the group of Global Risk, event rate ±1.5 SE. RANDOMISED DEATH/MI/STROKE - PCI RANDOMISED DEATH/MI/STROKE - CABG 15 IV. Additional Comparative Analyses (CABG and PCI) for the GRCINT & GRCHIGH groups in the Global, LMS & 3VD Randomised SYNTAX Populations Tables 4-6: Comparisons (CABG & PCI) for the GRCINT Groups Table 4 Principal effectiveness and safety results, summary of time-to-event analyses intentto-treat, comparing GRCINT for the Global Randomised PCI and Global Randomised CABG patients (N=687) Event 3 Year Post-Allocation MACCE Death/Stroke/MI, Any Death, Any Cerebrovascular Event (Stroke), Any MI, Any Revascularization, Any PCI CABG Post-Procedure Stent Thrombosis/Graft Occlusion Difference Relative % Change p-Value1 2.06 [1.51, 2.80] 16.1% 88.2% <.0001 19.6% (64) 12.3% (40) 1.95 [1.30, 2.94] 2.57 [1.46, 4.53] 9.2% 7.4% 88.9% 148.9% 0.0010 0.0007 2.7% (9) 3.0% (9) 1.09 [0.43, 2.75] 0.3% 11.7% 0.8515 4.3% (15) 10.7% (36) 9.6% (31) 22.7% (72) 2.26 [1.22, 4.19] 2.32 [1.56, 3.47] 5.4% 12.1% 125.7% 112.8% 0.0076 <.0001 9.0% (30) 1.7% (6) 18.3% (58) 6.1% (19) 2.24 [1.44, 3.48] 3.48 [1.39, 8.71] 9.3% 4.4% 103.4% 259.6% 0.0002 0.0045 3.1% (10) 4.6% (15) 1.62 [0.73, 3.62] 1.6% 50.8% 0.2304 CABG (N=357) TAXUS (N=330) Hazard Ratio [95% CI] 18.2% (63) 34.3% (112) 10.4% (36) 4.9% (17) 16 Table 5 Principal effectiveness and safety results, summary of time-to-event analyses intentto-treat, comparing GRCINT for the Randomised LMS population (N=290). Event 3 Year Post-Allocation MACCE Death/Stroke/MI, Any Death, Any Cerebrovascular Event (Stroke), Any MI, Any Revascularization, Any PCI CABG Post-Procedure Stent Thrombosis/Graft Occlusion Difference Relative % Change p-Value1 2.00 [1.26, 3.19] 1.49 [0.81, 2.75] 16.4% 5.7% 84.9% 46.8% 0.0028 0.1959 11.0% (16) 1.96 [0.84, 4.59] 5.2% 91.2% 0.1123 2.2% (3) 0.7% (1) 0.33 [0.03, 3.14] -1.5% -66.9% 0.3076 6.3% (9) 11.7% (16) 8.9% (12) 11.1% (16) 27.4% (39) 21.0% (30) 1.73 [0.76, 3.91] 2.57 [1.44, 4.60] 2.65 [1.36, 5.18] 4.7% 15.7% 12.1% 74.3% 133.8% 135.4% 0.1837 0.0010 0.0030 2.8% (4) 9.4% (13) 3.22 [1.05, 9.86] 6.6% 232.6% 0.0307 4.5% (6) 6.9% (10) 1.63 [0.59, 4.49] 2.5% 55.4% 0.3394 CABG (N=143) TAXUS (N=147) Hazard Ratio [95% CI] 19.3% (27) 12.1% (17) 35.6% (52) 17.8% (26) 5.7% (8) Table 6 Principal effectiveness and safety results, summary of time-to-event analyses intentto-treat, comparing GRCINT for the Randomised 3VD population (N=397). Event 3 Year Post-Allocation MACCE Death/Stroke/MI, Any Death, Any Cerebrovascular Event (Stroke), Any MI, Any Revascularization, Any PCI CABG Post-Procedure Stent Thrombosis/Graft Occlusion Difference Relative % Change p-Value1 2.08 [1.38, 3.15] 2.39 [1.38, 4.14] 3.14 [1.46, 6.75] 15.7% 11.8% 9.0% 89.3% 127.8% 203.9% 0.0004 0.0014 0.0020 4.9% (8) 1.58 [0.55, 4.54] 1.9% 61.1% 0.3959 2.9% (6) 10.0% (20) 9.1% (18) 0.9% (2) 8.4% (15) 18.9% (33) 16.2% (28) 3.4% (6) 2.98 [1.16, 7.68] 2.06 [1.18, 3.59] 1.92 [1.06, 3.47] 3.54 [0.72, 17.56] 5.6% 8.9% 7.1% 2.5% 194.4% 89.1% 77.8% 260.3% 0.0175 0.0092 0.0280 0.0980 2.1% (4) 2.8% (5) 1.46 [0.39, 5.43] 0.6% 29.9% 0.5716 CABG (N=214) TAXUS (N=183) Hazard Ratio [95% CI] 17.6% (36) 9.2% (19) 4.4% (9) 33.3% (60) 21.1% (38) 13.4% (24) 3.0% (6) 17 Tables 7-9: Comparisons (CABG and PCI) for the GRCHIGH Groups Table 7 Principal effectiveness and safety results, summary of time-to-event analyses intentto-treat, comparing GRCHIGH for the Global Randomised PCI and Global Randomised CABG patients (N=181). Event 3 Year Post-Allocation MACCE Death/Stroke/MI, Any Death, Any Cerebrovascular Event (Stroke), Any MI, Any Revascularization, Any PCI CABG Post-Procedure Stent Thrombosis/Graft Occlusion Difference Relative % Change p-Value1 1.56 [0.92, 2.63] 1.05 [0.57, 1.92] 1.09 [0.54, 2.18] 11.2% 0.5% 0.6% 40.9% 2.1% 3.1% 0.0973 0.8796 0.8095 3.8% (3) 0.47 [0.12, 1.89] -3.4% -47.0% 0.2780 3.4% (3) 3.9% (3) 3.9% (3) 9.5% (8) 25.5% (21) 22.1% (18) 2.64 [0.70, 9.95] 7.35 [2.19, 24.63] 6.19 [1.82, 21.01] 6.1% 21.5% 18.2% 179.2% 548.4% 463.7% 0.1358 0.0001 0.0008 0.0% (0) 3.6% (3) NA [NA, NA] 3.6% NA 0.0845 0.0% (0) 3.5% (3) NA [NA, NA] 3.5% NA 0.0895 CABG (N=90) TAXUS (N=91) Hazard Ratio [95% CI] 27.4% (23) 23.8% (20) 18.2% (15) 38.7% (35) 24.3% (22) 18.8% (17) 7.2% (6) Table 8 Principal effectiveness and safety results, summary of time-to-event analyses intentto-treat, comparing GRCHIGH for the Randomised LMS population (N=93). Event 3 Year Post-Allocation MACCE Death/Stroke/MI, Any Death, Any Cerebrovascular Event (Stroke), Any MI, Any Revascularization, Any PCI CABG Post-Procedure Stent Thrombosis/Graft Occlusion Difference Relative % Change p-Value1 1.46 [0.72, 2.97] 10.6% 36.6% 0.2880 25.6% (11) 18.6% (8) 0.94 [0.42, 2.10] 1.05 [0.41, 2.72] -1.3% -0.3% -4.7% -1.5% 0.8859 0.9193 10.6% (5) 5.4% (2) 0.45 [0.09, 2.34] -5.2% -49.2% 0.3315 6.0% (3) 5.7% (2) -0.3% -4.8% 0.7773 2.3% (1) 24.3% (9) 22.1% 970.9% 0.0031 2.3% (1) 21.7% (8) 19.4% 853.4% 0.0069 0.0% (0) 2.6% (1) 0.77 [0.13, 4.61] 11.67 [1.48, 92.11] 10.13 [1.27, 81.01] NA [NA, NA] 2.6% NA 0.2712 0.0% (0) 0.0% (0) NA [NA, NA] 0.0% NA Undef CABG (N=50) TAXUS (N=43) Hazard Ratio [95% CI] 28.9% (14) 39.5% (17) 26.8% (13) 18.9% (9) 18 Table 9 Principal effectiveness and safety results, summary of time-to-event analyses intentto-treat, comparing GRCHIGH for the Randomised 3VD population (N=88). Event 3 Year Post-Allocation MACCE Death/Stroke/MI, Any Death, Any Cerebrovascular Event (Stroke), Any MI, Any Revascularization, Any PCI CABG Post-Procedure Stent Thrombosis/Graft Occlusion Difference Relative % Change p-Value1 1.71 [0.77, 3.80] 1.28 [0.49, 3.29] 1.16 [0.41, 3.26] 12.4% 3.4% 1.9% 49.0% 17.0% 11.3% 0.1850 0.6146 0.7772 2.3% (1) 0.76 [0.05, 12.20] -0.5% -16.3% 0.8480 0.0% (0) 6.0% (2) 6.0% (2) 12.7% (6) 26.1% (12) 22.2% (10) NA [NA, NA] 4.87 [1.09, 21.76] 4.01 [0.88, 18.30] 12.7% 20.1% 16.2% NA 332.2% 268.1% 0.0253 0.0217 0.0525 0.0% (0) 4.4% (2) NA [NA, NA] 4.4% NA 0.2090 0.0% (0) 6.3% (3) NA [NA, NA] 6.3% NA 0.1341 CABG (N=40) TAXUS (N=48) Hazard Ratio [95% CI] 25.4% (9) 19.8% (7) 17.1% (6) 37.9% (18) 23.2% (11) 19.0% (9) 2.8% (1) 19 V. Reclassification Analyses for Randomised SYNTAX Population Tables 10-11: Reclassification Analyses Table 10 Reclassification analyses (intermediate SXscore and low-intermediate EuroSCORE reclassified to GRCLOW) within the randomised SYNTAX Population: Kaplan-Meier event rates in reclassified PCI and CABG patients are shown. Reclassified SYNTAX Population Randomised Randomised LMS Randomised 3VD Outcome Event Rates/Total Reclassified CABG Patients Event Rates/Total Reclassified PCI Patients 3-Year MACCE 3-Year death 3-Year MACCE 3-Year Death 3-Year MACCE 3-Year Death 18.7% (39/222) 6.4% (13/222) 24.4% (16/68) 10.8% (7/68) 16.1% (23/154) 4.3% (6/154) 23.0% (55/242) 5.4% (13/242) 15.6% (12/77) 1.3% (1/77) 26.4% (43/165) 7.4% (12/165) Table 11 Reclassification analyses (low SXscore and high EuroSCORE reclassified to GRC INT) within the randomised SYNTAX Population: Kaplan-Meier event rates in the reclassified CABG and PCI patients are shown. Reclassified SYNTAX Population Randomised Randomised LMS Randomised 3VD Outcome Event Rates/Total Reclassified CABG Patients Event Rates/Total Reclassified PCI Patients 3-Year MACCE 3-Year Death 3-Year MACCE 3-Year Death 3-Year MACCE 3-Year Death 24.8% (12/53) 10.1% (5/53) 28.6% (5/19) 11.1% (2/19) 22.5% (7/34) 9.6% (3/34) 32.1% (20/63) 14.5% (9/63) 24.1% (7/29) 6.9% (2/29) 39.1% (13/34) 21.3% (7/34) 20 VI. Additional Analyses for the All-Comers (Entire Population and LMS/3VD Cohorts) SYNTAX Population Figure 9: Kaplan Meier curves for cumulative rate of Death (upper), and MACCE (lower) in the Global ‘All-Comers’ SYNTAX population at 3-year follow-up stratified according to the group of Global Risk, event rate ±1.5 SE. ‘ALL-COMERS’ DEATH - PCI ‘ALL-COMERS’ DEATH - CABG ‘ALL-COMERS’ MACCE - PCI ‘ALL-COMERS’ MACCE - CABG 21 Figure 10 Comparison of different risk models for the Global ‘All-Comers’ SYNTAX population Death (left) and MACCE (right), utilising calibration (Hosmer-Lemeshow test), discrimination (c-statistic) and overall model performances (Brier score). Renal function was not collected in all nested registry patients, consequently the ACEF based scores were excluded from the analysis below. ALL-COMERS SYNTAX POPULATION – 3-YEAR MACCE ALL-COMERS SYNTAX POPULATION – 3-YEAR DEATH 22 Figure 11 Comparison of different risk models for the ‘All-Comers’ LMS and 3VD populations for Death (upper) and MACCE (lower) at 3-Years. A smaller Brier score (x-axis) and larger c-statistic (y-axis) represents a better predictive ability of the risk model.(17) Yellow arrows represent the incremental predictive benefit of the GRC compared to the SXscore and additive EuroSCORE within the LMS PCI population, not evident within the 3VD PCI population with comparability of the GRC and additive EuroSCORE. Striped circles represents calibrated additive EuroSCORE and non-calibrated logistic EuroSCORE in the LMS CABG (MACCE) population and calibrated additive EuroSCORE and non-calibrated GRC within the 3VD CABG (MACCE) population. The renal function was not collected in all nested registry patients, consequently the ACEF based scores were excluded from the analysis below. 23 ‘ALL-COMERS’ LMS and 3VD Cohorts: 3-Year Death 3VD Cohort LMS Cohort ‘ALL-COMERS’ LMS and 3VD Cohorts: 3-Year MACCE LMS Cohort 3VD Cohort 24 Tables 12-14: Comparisons (CABG and PCI) of low Global Risk Groups (GRCLOW) Table 12 Principal effectiveness and safety results, summary of time-to-event analyses intentto-treat, all low Global Risk groups (GRCLOW) for ‘All-Comers’ CABG and ‘AllComers’ PCI patients (N=1156) Event 3 Year Post-Allocation MACCE Death/Stroke/MI, Any Death, Any Cerebrovascular Event (Stroke), Any MI, Any Revascularisation, Any PCI CABG Post-Procedure Stent Thrombosis/Graft Occlusion CABG (N=626) PCI (N=530) Hazard Ratio [95% CI] Difference pValue 18.0% (108) 10.3% (62) 5.2% (31) 22.3% (117) 8.8% (46) 4.8% (25) 1.28 [0.98, 1.66] 0.84 [0.57, 1.23] 0.92 [0.54, 1.56] 4.4% -1.5% -0.4% 0.067 0.38 0.76 3.5% (21) 1.2% (6) 0.32 [0.13, 0.80] -2.4% 0.01 2.8% (17) 4.8% (25) 1.70 [0.92, 3.15] 2.0% 0.088 9.7% (57) 9.2% (54) 0.8% (5) 17.2% (89) 14.7% (76) 3.7% (19) 1.87 [1.34, 2.61] 1.67 [1.18, 2.37] 4.41 [1.65, 11.82] 7.5% 5.5% 2.9% 0.0002 0.0035 0.0012 3.4% (20) 3.5% (18) 1.03 [0.55, 1.95] 0.1% 0.92 Table 13 Principal effectiveness and safety results, summary of time-to-event analyses intentto-treat, comparing GRCLOW groups for ‘All-Comers’ LMS CABG and ‘AllComers’ LMS PCI patients (N=419). Event 3 Year Post-Allocation MACCE Death/Stroke/MI, Any Death, Any Stroke, Any MI, Any Revascularisation, Any PCI CABG Post-Procedure Stent Thrombosis/Graft Occlusion CABG (N=234) PCI (N=185) Hazard Ratio [95% CI] Difference pValue 18.0% (41) 18.5% (34) 9.6% (22) 5.3% (12) 4.0% (9) 0.9% (2) 10.7% (24) 9.8% (22) 6.6% (12) 2.7% (5) 0.6% (1) 3.9% (7) 14.8% (27) 12.0% (22) 1.02 [0.65, 1.60] 0.6% 0.94 0.65 [0.32, 1.32] 0.51 [0.18, 1.44] 0.13 [0.02, 1.05] 4.30 [0.89, 20.69] 1.40 [0.81, 2.42] 1.23 [0.68, 2.22] -3.1% -2.6% -3.5% 3.0% 4.1% 2.2% 0.23 0.19 0.025 0.047 0.23 0.49 0.9% (2) 3.8% (7) 4.37 [0.91, 21.02] 3.0% 0.044 4.0% (9) 2.3% (4) 0.54 [0.17, 1.74] -1.7% 0.29 25 Table 14 Principal effectiveness and safety results, summary of time-to-event analyses intentto-treat, comparing GRCLOW groups for ‘All-Comers’ 3VD PCI and ‘All-Comers’ 3VD CABG patients (N=737). Event 3 Year Post-Allocation MACCE Death/Stroke/MI, Any Death, Any Stroke, Any MI, Any Revascularisation, Any PCI CABG Post-Procedure Stent Thrombosis/Graft Occlusion CABG (N=392) PCI (N=345) Hazard Ratio [95% CI] Difference pValue 17.9% (67) 10.7% (40) 5.1% (19) 3.2% (12) 24.4% (83) 10.0% (34) 5.9% (20) 1.5% (5) 1.42 [1.03, 1.96] 0.93 [0.59, 1.47] 1.16 [0.62, 2.17] 0.46 [0.16, 1.30] 6.4% -0.7% 0.7% -1.7% 0.031 0.76 0.65 0.13 4.0% (15) 9.1% (33) 8.8% (32) 0.8% (3) 5.3% (18) 18.5% (62) 16.2% (54) 3.6% (12) 1.34 [0.67, 2.65] 2.20 [1.44, 3.35] 1.96 [1.27, 3.04] 4.45 [1.26, 15.79] 1.3% 9.5% 7.4% 2.8% 0.41 0.0002 0.0021 0.011 3.0% (11) 4.2% (14) 1.41 [0.64, 3.10] 1.2% 0.40 26 VII. Reclassification Analyses for ‘All-Comers’ SYNTAX Population Tables 15-16: Reclassification Analyses Table 15 Reclassification analyses (intermediate SXscore and low-intermediate EuroSCORE reclassified to GRCLOW) within the ‘All-Comers’ SYNTAX Population: KaplanMeier event rates in reclassified PCI and CABG patients are shown. Reclassified SYNTAX Population All-Comers All-Comers LMS All-Comers 3VD Outcome Event Rates/Total Reclassified CABG Patients Event Rates/Total Reclassified PCI Patients 3-Year MACCE 3-Year Death 3-Year MACCE 3-Year Death 3-Year MACCE 3-Year Death 16.7% (56/350) 4.8% (16/350) 18.8% (21/114) 6.3% (7/114) 15.6% (35/236) 4.1% (9/236) 23.3% (62/269) 6.0% (16/269) 19.0% (16/84) 3.6% (3/84) 25.2% (46/185) 7.1% (13/185) Table 16 Reclassification analyses (low SXscore and high EuroSCORE reclassified to GRC INT) within the ‘All-Comers’ SYNTAX Population: Kaplan-Meier event rates in reclassified PCI and CABG patients are shown. Reclassified SYNTAX Population All-Comers All-Comers LMS All-Comers 3VD Outcome Event Rates/Total Reclassified CABG Patients Event Rates/Total Reclassified PCI Patients 3-Year MACCE 3-Year Death 3-Year MACCE 3-Year Death 3-Year MACCE 3-Year Death 21.1% (13/66) 8.1% (5/66) 20.4% (5/26) 8.0% (2/26) 21.4% (8/40) 8.2% (3/40) 30.8% (25/82) 13.6% (11/82) 27.0% (10/37) 10.8% (4/37) 33.9% (15/45) 15.9% (7/45) 27 VIII. Additional Material: Fig. 12 Vessel Distribution in the LMS Population According to SYNTAX Score Tertiles. Upper graphs: proportion of LMS population with isolated LMS disease, or associated with one (1VD), two (2VD) or three vessel disease (3VD). Middle graphs: proportion of LMS disease with non distal disease (non distal), distal bifurcation disease (distal) or both components (both). Lower graphs: proportion of non-total occlusion and total-occlusion disease within the coronary tree (not within the LMS). 28 IX. Additional References 1. Serruys PW, Morice MC, Kappetein AP, et al. Percutaneous coronary intervention versus coronary-artery bypass grafting for severe coronary artery disease. N Engl J Med 2009;360:961-72. Sianos G, Morel MA, A.P. K, et al. The SYNTAX Score: an angiographic tool grading the complexity of coronary artery disease. EuroIntervention, 2005 219-227. Serruys PW, Onuma Y, Garg S, et al. Assessment of the SYNTAX score in the Syntax study. EuroIntervention : journal of EuroPCR in collaboration with the Working Group on Interventional Cardiology of the European Society of Cardiology 2009;5:50-6. SYNTAX score calculator: http://www.syntaxscore.com. SYNTAX workinggroup. Launched 19th May 2009. Ranucci M, Castelvecchio S. The ACEF score one year after: a skeleton waiting for muscles, skin, and internal organs. EuroIntervention : journal of EuroPCR in collaboration with the Working Group on Interventional Cardiology of the European Society of Cardiology 2010;6:549-53. Ranucci M, Castelvecchio S, Menicanti L, Frigiola A, Pelissero G. Risk of assessing mortality risk in elective cardiac operations: age, creatinine, ejection fraction, and the law of parsimony. Circulation 2009;119:3053-61. Wykrzykowska JJ, Garg S, Onuma Y, et al. Value of age, creatinine, and ejection fraction (ACEF score) in assessing risk in patients undergoing percutaneous coronary interventions in the 'All-Comers' LEADERS trial. Circulation. Cardiovascular interventions 2011;4:47-56. Garg S, Sarno G, Garcia-Garcia HM, et al. A new tool for the risk stratification of patients with complex coronary artery disease: the Clinical SYNTAX Score. Circulation. Cardiovascular interventions 2010;3:317-26. Cockcroft DW, Gault MH. Prediction of creatinine clearance from serum creatinine. Nephron 1976;16:31-41. Nashef SA, Roques F, Michel P, Gauducheau E, Lemeshow S, Salamon R. European system for cardiac operative risk evaluation (EuroSCORE). European journal of cardio-thoracic surgery : official journal of the European Association for Cardio-thoracic Surgery 1999;16:9-13. Roques F, Michel P, Goldstone AR, Nashef SA. The logistic EuroSCORE. European heart journal 2003;24:881-2. Kappetein AP, Feldman TE, Mack MJ, et al. Comparison of coronary bypass surgery with drug-eluting stenting for the treatment of left main and/or threevessel disease: 3-year follow-up of the SYNTAX trial. European Heart Journal 2011. Kim Y-H, Park D-W, Kim W-J, et al. Validation of SYNTAX (Synergy between PCI with Taxus and Cardiac Surgery) Score for Prediction of Outcomes After Unprotected Left Main Coronary Revascularization. J Am Coll Cardiol Intv 2010;3:612-623. Min SY, Park DW, Yun SC, et al. Major predictors of long-term clinical outcomes after coronary revascularization in patients with unprotected left main coronary disease: analysis from the MAIN-COMPARE study. Circulation. Cardiovascular interventions 2010;3:127-33. 2. 3. 4. 5. 6. 7. 8. 9. 10. 11. 12. 13. 14. 29 15. 16. 17. Romagnoli E, Burzotta F, Trani C, et al. EuroSCORE as predictor of inhospital mortality after percutaneous coronary intervention. Heart 2009;95:438. Kim YH, Ahn JM, Park DW, et al. EuroSCORE as a predictor of death and myocardial infarction after unprotected left main coronary stenting. The American journal of cardiology 2006;98:1567-70. Steyerberg EW, Vickers AJ, Cook NR, et al. Assessing the performance of prediction models: a framework for traditional and novel measures. Epidemiology;21:128-38. 30
