Sarah Larson
advertisement
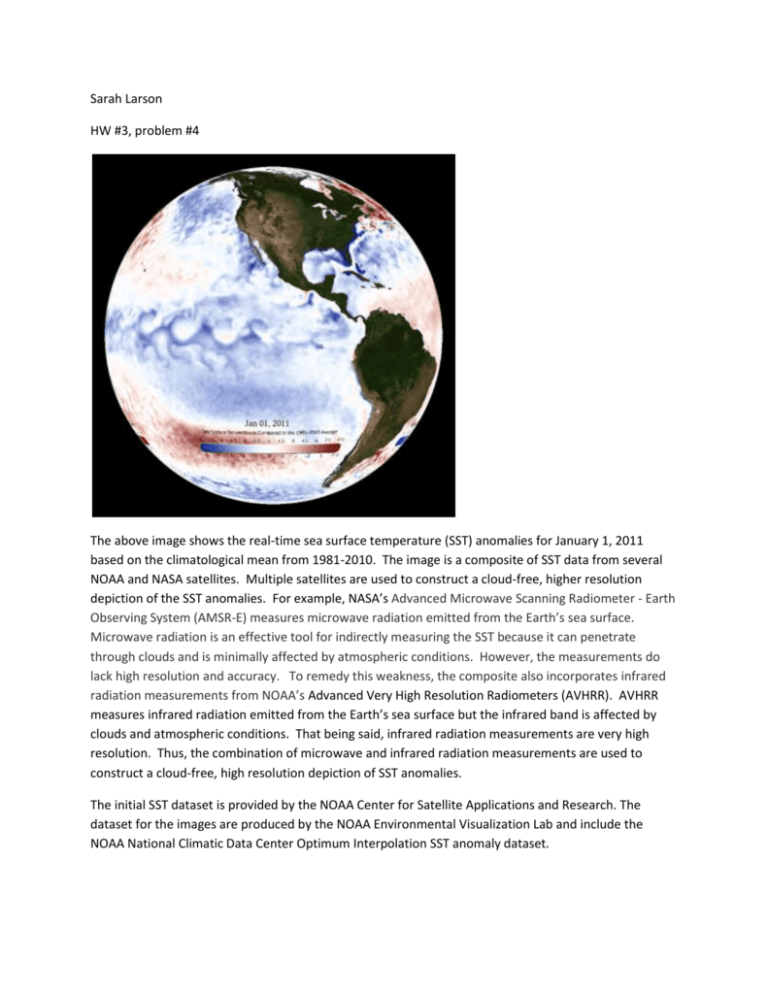
Sarah Larson HW #3, problem #4 The above image shows the real-time sea surface temperature (SST) anomalies for January 1, 2011 based on the climatological mean from 1981-2010. The image is a composite of SST data from several NOAA and NASA satellites. Multiple satellites are used to construct a cloud-free, higher resolution depiction of the SST anomalies. For example, NASA’s Advanced Microwave Scanning Radiometer - Earth Observing System (AMSR-E) measures microwave radiation emitted from the Earth’s sea surface. Microwave radiation is an effective tool for indirectly measuring the SST because it can penetrate through clouds and is minimally affected by atmospheric conditions. However, the measurements do lack high resolution and accuracy. To remedy this weakness, the composite also incorporates infrared radiation measurements from NOAA’s Advanced Very High Resolution Radiometers (AVHRR). AVHRR measures infrared radiation emitted from the Earth’s sea surface but the infrared band is affected by clouds and atmospheric conditions. That being said, infrared radiation measurements are very high resolution. Thus, the combination of microwave and infrared radiation measurements are used to construct a cloud-free, high resolution depiction of SST anomalies. The initial SST dataset is provided by the NOAA Center for Satellite Applications and Research. The dataset for the images are produced by the NOAA Environmental Visualization Lab and include the NOAA National Climatic Data Center Optimum Interpolation SST anomaly dataset.

