Statistical Methods Curriculum
advertisement
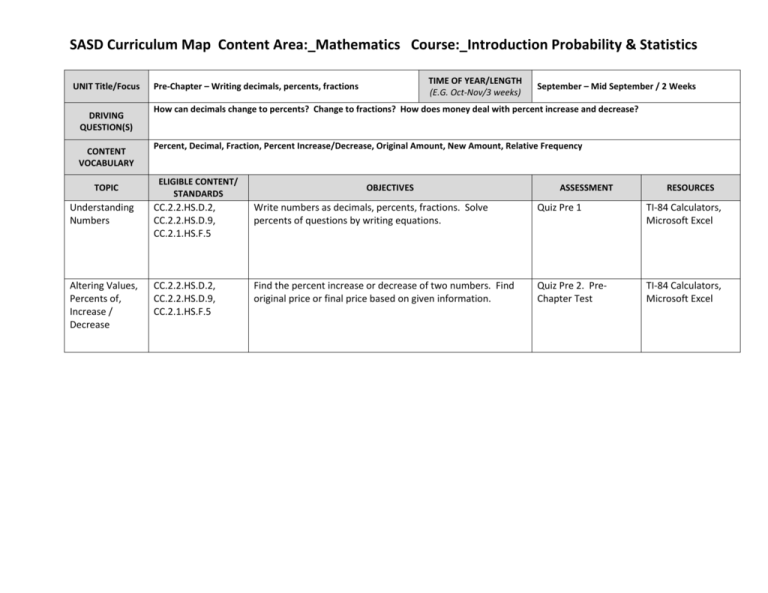
SASD Curriculum Map Content Area:_Mathematics Course:_Introduction Probability & Statistics UNIT Title/Focus DRIVING QUESTION(S) CONTENT VOCABULARY TOPIC TIME OF YEAR/LENGTH (E.G. Oct-Nov/3 weeks) Pre-Chapter – Writing decimals, percents, fractions September – Mid September / 2 Weeks How can decimals change to percents? Change to fractions? How does money deal with percent increase and decrease? Percent, Decimal, Fraction, Percent Increase/Decrease, Original Amount, New Amount, Relative Frequency ELIGIBLE CONTENT/ STANDARDS OBJECTIVES ASSESSMENT RESOURCES Understanding Numbers CC.2.2.HS.D.2, CC.2.2.HS.D.9, CC.2.1.HS.F.5 Write numbers as decimals, percents, fractions. Solve percents of questions by writing equations. Quiz Pre 1 TI-84 Calculators, Microsoft Excel Altering Values, Percents of, Increase / Decrease CC.2.2.HS.D.2, CC.2.2.HS.D.9, CC.2.1.HS.F.5 Find the percent increase or decrease of two numbers. Find original price or final price based on given information. Quiz Pre 2. PreChapter Test TI-84 Calculators, Microsoft Excel SASD Curriculum Map Content Area:_Mathematics Course:_Introduction Probability & Statistics UNIT Title/Focus DRIVING QUESTION(S) CONTENT VOCABULARY TOPIC Chapter 1 – Working with Univariate and Bivariate Categorical Variables TIME OF YEAR/LENGTH (E.G. Oct-Nov/3 weeks) Mid September – Early October / 3 Weeks What is a categorical variable and what can be done with it? How can categorical variables be represented? How can one variable depend on another variable? Relative Frequency, Bar Graph, Contingency Table, Circle (Pie) Chart, Segmented Bar Graphs, Nominal, Ordinal, Interval, Ratio. ELIGIBLE CONTENT/ STANDARDS OBJECTIVES ASSESSMENT RESOURCES Identify Variables by Type CC.2.4.HS.B.1 Identify a variable by nominal, ordinal, interval, ratio. Find relative frequency from a frequency table. Answer basic questions regarding probability using relative frequency. Textbook and TI-84 Calculators Construct Charts for Single Categorical Variables CC.2.4.HS.B.1, CC.2.1.HS.F.3 Construct either a horizontal or vertical bar graph using either frequency or relative frequency. Construct a labeled pie chart using a protractor. Answer basic questions using the categorical displays. Quiz on bar and circle graphs Textbook and TI-84 Calculators. Microsoft Excel. Construct Charts for Two Categorical Variables CC.2.4.HS.B.2, CC.2.4.HS.B.5-6, CC.2.1.HS.F.3 Construct a relative frequency, row relative frequency, or column relative frequency contingency table. Construct a segmented bar graph from a RRF or CRF. Determine whether or not two variables are dependent by looking at the graphs as well as calculating probabilities. Quiz on contingency tables. Test Chapter 1. Textbook and TI-84 Calculators SASD Curriculum Map Content Area:_Mathematics Course:_Introduction Probability & Statistics UNIT Title/Focus DRIVING QUESTION(S) CONTENT VOCABULARY TOPIC Chapter 2 – Working with Univariate Quantitative Variables TIME OF YEAR/LENGTH (E.G. Oct-Nov/3 weeks) Early October – Early November / 4 Weeks What is a quantitative variable and what can be done with it? How can quantitative variables be represented in a graph? What can be done numerically with quantitative variables? Discrete Random Variable, Continuous Random Variable, Mean, Median, Mode, Range, IQR, Standard Deviation, Relative Frequency, Dotplot, Stem-and-Leaf, Histogram, Box and Whisker ELIGIBLE CONTENT/ STANDARDS OBJECTIVES ASSESSMENT RESOURCES Identify Variables by Type CC.2.4.HS.B.1 Identify interval and ratio variables. Decide whether or not the variable is discrete or continuous. Place values in a calculator and find one variable statistics (mean, median, mode, range, IQR, standard deviation). Find relative frequency from a frequency table. Quiz on identifying variables and listing one variable statistics Textbook and TI-84 Calculators Construct Charts for Single Quantitative Variables CC.2.1.HS.F.3, CC.2.4.HS.B.1, CC.2.4.HS.B.2 Construct all types of quantitative graphs both by hand and when applicable, with the calculator: This includes, dotplot, stem-and-leaf, histogram, and box and whisker. Quiz on univariate quantitative graphs Textbook and TI-84 Calculators. Microsoft Excel. Compare Quantitative Variables Distributed Across Categories CC.2.1.HS.F.3, CC.2.4.HS.B.1, CC.2.4.HS.B.2 Construct stacked univariate distributions when grouped by outcomes of a categorical variable. Quiz on contingency tables. Test Chapter 2. Textbook and TI-84 Calculators SASD Curriculum Map Content Area:_Mathematics Course:_Introduction Probability & Statistics UNIT Title/Focus DRIVING QUESTION(S) CONTENT VOCABULARY TOPIC Sketching Scatterplots and create Line of Best Fit for predictions Least Squares Regression Line and Residuals Chapter 3 – Working with Bivariate Quantitative Variables TIME OF YEAR/LENGTH (E.G. Oct-Nov/3 weeks) Early November – Late November / 3 Weeks How can we visualize an association between two quantitative variables? If an association exists, how can we create a mathematical model (equation) that can make relatively accurate predictions? Independent and Dependent Variables, Line of Best Fit, Least Squares Regression Line, Interpolation, Extrapolation, Correlation, WeakModerate-Strong Association. ELIGIBLE CONTENT/ STANDARDS CC.2.1.HS.F.3, CC.2.4.HS.B.2, CC.2.4.HS.B.3, CC.2.4.HS.B.5, CC.2.2.HS.C.2, CC.2.2.HS.C.6 CC.2.1.HS.F.3, CC.2.4.HS.B.2, CC.2.4.HS.B.3, CC.2.4.HS.B.5, CC.2.2.HS.C.2, CC.2.2.HS.C.6 OBJECTIVES ASSESSMENT RESOURCES Accurately construct a scatterplot to scale. State both strength and direction of an association. Produce similar results in a calculator. Algebraically calculate a Line of Best Fit using two points (slope and y-intercept). Make simple predictions using the LOBF. Quiz and group project Textbook and TI-84 Calculators Use the calculator (as well as formulas) to find the Least Squares Regression Line. Compare The LSRL to the LOBF. Discuss residuals, what they mean, and how to construct a residual scatterplot. Quiz, more group projects, Test Chapter 3. Textbook, TI-84 Calculators, and Excel SASD Curriculum Map Content Area:_Mathematics Course:_Introduction Probability & Statistics UNIT Title/Focus DRIVING QUESTION(S) CONTENT VOCABULARY TOPIC TIME OF YEAR/LENGTH (E.G. Oct-Nov/3 weeks) Chapter 4 – Simulation, Sampling, and Study Design Late November – Early January / 4 Weeks How can a simulation model reality and games? What can be used in a simulation? Why do we take samples from populations? How can sampling go horribly wrong? When not sampling, what characteristics constitute a well-developed, representative study? How and why do we randomize? What Simulation, Randomization, Sample, Population, Sampling, SRS, Systematic, Stratified, Cluster, Multistage, Bias (response and nonresponse), Sampling Error (variability), Observational Study, Simple Experimental Design, Blocking, Matched Pairs, Statistically Significant, Blinding, Placebo ELIGIBLE CONTENT/ STANDARDS OBJECTIVES ASSESSMENT RESOURCES Simulation Methods and Understanding Randomness CC.2.4.HS.B.4 Simulate real world events using objects (dice, cards, and spinners), random number tables, and technology (calculator, random number generator). Discuss what probability means in context to simulation. Simulation Quiz Textbook and TI-84 Calculators Sampling and Bias CC.2.4.HS.B.4, CC.2.4.HS.B.5 Discuss different sampling methods that could be used to construct a representative sample from a population. Discuss how bias will always play a role in sampling, and how it can be limited. Sampling Quiz and group activity Textbook and TI-84 Calculators Study Design and Best Practices CC.2.4.HS.B.4, CC.2.4.HS.B.5 If possible, construct all three types of study designs for a given scenario, discussing advantages and disadvantages for each. Understand the cause and effect relationship of experimentation, and differentiate among experiments and observational studies Study Design Quiz, group activity, and Test Chapter 4 Textbook and TI-84 Calculators SASD Curriculum Map Content Area:_Mathematics Course:_Introduction Probability & Statistics UNIT Title/Focus DRIVING QUESTION(S) CONTENT VOCABULARY TOPIC TIME OF YEAR/LENGTH (E.G. Oct-Nov/3 weeks) Chapter 5 – Probability Late January – Mid February / 3 Weeks What are the basic rules to probability, and how do I apply these rules to the world? What can I use (Venn Diagram, charts) to help me grasp probability? How can contingency tables help me solve problems involving conditional probability? Am I able to look for association and dependencies among categorical variables using probability? Sample Space, Element, Component, Trial, Formal Probability, Venn Diagram, Additional Rule, Multiplication Rule, Independent, Mutually Exclusive, Conditional Probability, Bayes Rule, Tree Diagram ELIGIBLE CONTENT/ STANDARDS OBJECTIVES ASSESSMENT RESOURCES Basic Probability Rules and Venn Diagrams CC.2.4.HS.B.1, CC.2.4.HS.B.7 Understand the formal aspects and rules to finding basic probability. Group outcomes together and display possible outcomes using Venn Diagrams. Use both the addition and multiplication rules to find the likelihood of possible outcomes Venn Diagram Quiz Textbook and TI-84 Calculators Contingency Tables and Segmented Bar Graphs CC.2.4.HS.B.1, CC.2.4.HS.B.6, CC.2.4.HS.B.7 Construct and interpret a contingency table to both find probabilities and look for associations among variables. Use formulas to find probabilities, and use those probabilities to construct segmented bar graphs Contingency Table Quiz Textbook and TI-84 Calculators Tree Diagrams and Constructing Probability Tables CC.2.4.HS.B.1, CC.2.4.HS.B.6, CC.2.4.HS.B.7 Construct probability charts and tree diagrams that show either dependent events or multiple events. Calculate probabilities using formulas Probability Test Chapter 5 Textbook and TI-84 Calculators SASD Curriculum Map Content Area:_Mathematics Course:_Introduction Probability & Statistics UNIT Title/Focus DRIVING QUESTION(S) CONTENT VOCABULARY TOPIC Chapter 6 – Counting Principles, Combinations, and Permutations TIME OF YEAR/LENGTH (E.G. Oct-Nov/3 weeks) Mid February – Early March / 2 Weeks How can combinations and permutations play a role in find the number of possible outcomes in given scenarios? How can I distinguish between the two, and when should I use one or the other? How do possible outcomes relate to probability? Combination, Permutation, Factorial, Multiplication Rule, Tree Diagram of Possible Outcomes ELIGIBLE CONTENT/ STANDARDS OBJECTIVES Counting Principle CC.2.2.HS.D.2, CC.2.2.HS.D.9, CC.2.4.HS.B.1, CC.2.1.HS.F.3 Use both tree diagrams as well as the counting principle to find total number of outcomes with multiple decisions Factorials and Permutations CC.2.2.HS.D.2, CC.2.2.HS.D.9, CC.2.4.HS.B.1 Identify situations that use permutations and find the total number of possible outcomes when selecting without replacement when order of selection matters Combinations and Probability CC.2.2.HS.D.2, CC.2.2.HS.D.9, CC.2.4.HS.B.1 Identify situations that use combinations and find the total number of possible outcomes when selecting without replacement when order of selection doesn’t matter. Extend counting principles to probability ASSESSMENT Counting Principle Quiz RESOURCES Textbook and TI-84 Calculators Textbook and TI-84 Calculators Counting Principles Test Chapter 6 Textbook and TI-84 Calculators SASD Curriculum Map Content Area:_Mathematics Course:_Introduction Probability & Statistics UNIT Title/Focus DRIVING QUESTION(S) CONTENT VOCABULARY TOPIC TIME OF YEAR/LENGTH (E.G. Oct-Nov/3 weeks) Chapter 7 – Expected Value and Game Theory Early March – Late March / 3 Weeks How can simple games of chance incorporate value to make them more entertaining? How can we model real world issues using the concept of expected value and risk / reward? What does expected value and standard deviation mean in context to a discrete random variable? How do I make a game “fair”, and what does it mean? Discrete Random Variable, Expected Value Table, Expected Value, Standard Deviation, Fair ELIGIBLE CONTENT/ STANDARDS OBJECTIVES ASSESSMENT RESOURCES Simple Games CC.2.4.HS.B.1, CC.2.4.HS.B.4, CC.2.4.HS.B.7 Understand the primary rules of gaming, how to create a tree diagram of outcomes, and fill in probabilities. One table is created, find expected value by hand and using a calculator Simple Gaming Quiz and group project Textbook and TI-84 Calculators Decision Making CC.2.4.HS.B.1, CC.2.4.HS.B.4, CC.2.4.HS.B.7 Extend gaming rules into real world decision making and risk taking; insurance, crime, best practices, gambling, etc. Decision Quiz Textbook and TI-84 Calculators Understanding Expected Value, Fairness, and Standard Deviation CC.2.4.HS.B.1, CC.2.4.HS.B.4, CC.2.4.HS.B.5, CC.2.4.HS.B.7 Identify a discrete random variable scenario that has attached Counting Principles value and use probabilities rules to not only construct a table Test Chapter 6 to calculate expected value, but use other calculations to make intelligent decisions about possible choices Textbook and TI-84 Calculators SASD Curriculum Map Content Area:_Mathematics Course:_Introduction Probability & Statistics UNIT Title/Focus DRIVING QUESTION(S) CONTENT VOCABULARY TOPIC TIME OF YEAR/LENGTH (E.G. Oct-Nov/3 weeks) Chapter 8 – Binomial and Geometric Distributions Late March – Late April / 3 Weeks What conditions must be met for either the Binomial or Geometric models to be applied? How are both distributions examples of Bernoulli Trials? How can we distinguish among the different distributions? How can technology make calculations remarkably simpler? Bernoulli Trial, Success, Failure, Set Trials, Binomial, Geometric, “first success”, Histogram, Probability Distribution, Expected Value ELIGIBLE CONTENT/ STANDARDS OBJECTIVES ASSESSMENT RESOURCES Bernoulli Trials and Identifying Characteristics CC.2.4.HS.B.1, CC.2.4.HS.B.4, CC.2.4.HS.B.7 Understand the rules of Bernoulli Trials, how they fit into discrete distributions, and how Binomial and Geometric go a few steps further Textbook and TI-84 Calculators Binomial Distributions CC.2.1.HS.F.3, CC.2.1.HS.F.4, CC.2.4.HS.B.1, CC.2.4.HS.B.4, CC.2.4.HS.B.7 Identify characteristics of binomial distributions, construct a histogram, and calculate probabilities with both a formula as well as the calculator. Make basic decisions based on likelihood of outcomes Binomial Distribution Quiz Textbook and TI-84 Calculators Geometric Distributions CC.2.1.HS.F.4, CC.2.4.HS.B.1, CC.2.4.HS.B.4, CC.2.4.HS.B.7 Differentiate among binomial and geometric distributions, construct a histogram for first successes, and calculate probabilities with both the formula as well as the calculator Binomial and Geometric Distribution Test Chapter 8 Textbook and TI-84 Calculators SASD Curriculum Map Content Area:_Mathematics Course:_Introduction Probability & Statistics UNIT Title/Focus DRIVING QUESTION(S) CONTENT VOCABULARY TOPIC Chapter 9 – Normal Distributions and Sampling Distributions TIME OF YEAR/LENGTH (E.G. Oct-Nov/3 weeks) Late April – Mid May / 2 to 3 Weeks How are continuous random variables different from discrete random variables? What types of real world phenomena fit the normal distribution? How does the Central Limit Theorem use both real world events and the normal model together? Continuous Random Variable, Population Mean, Population Standard Deviation, Normal Model, Standardized z-score, Lower and Upper Bounds, Sampling Distribution, Sample Size, Central Limit Theorem, Empirical Rule ELIGIBLE CONTENT/ STANDARDS OBJECTIVES ASSESSMENT RESOURCES Continuous Random Variables and the Normal Model CC.2.1.HS.F.3, CC.2.2.HS.C.6, CC.2.4.HS.B.1, CC.2.4.HS.B.7 Identify a variable that is continuous. Draw a normal model with three standard deviations above and below the mean. Discuss the Empirical (68-95-99.7 rule). Standardize x values and find probabilities in a calculator Quiz on Normal Model Textbook and TI-84 and Empirical Rule Calculators Standardizing and Unstandardizing Normal Distributions CC.2.1.HS.F.3, CC.2.2.HS.C.6, CC.2.4.HS.B.1, CC.2.4.HS.B.7 Use a formula to both standardize and unstandardized values. Go from an x to a probability and vice versa. Use a “reverse look up” using both the calculator and a probability table Standardizing Quiz Textbook and TI-84 Calculators Sampling Distribution CC.2.1.HS.F.3, CC.2.2.HS.C.6, CC.2.4.HS.B.1, CC.2.4.HS.B.6, CC.2.4.HS.B.7 Understand the concepts behind sampling distributions and the Central Limit Theorem. Use a formula to find probabilities of samples larger than size n=1. Make conjectures about the likelihood of certain events. Sampling Distribution Quiz and group activity. Test on the Normal Model Chapter 9 Textbook and TI-84 Calculators SASD Curriculum Map Content Area:_Mathematics Course:_Introduction Probability & Statistics UNIT Title/Focus TOPIC Review of Chapters 1-9 TIME OF YEAR/LENGTH (E.G. Oct-Nov/3 weeks) End of Year Review ELIGIBLE CONTENT/ STANDARDS All Standards above OBJECTIVES Complete review packets and graph underlying connections among all content learned in statistics this year. Mid to Late May – Early June / 1 to 2 Weeks ASSESSMENT Final Exam RESOURCES Textbook and TI-84 Calculators
