Big Data Exploration
advertisement
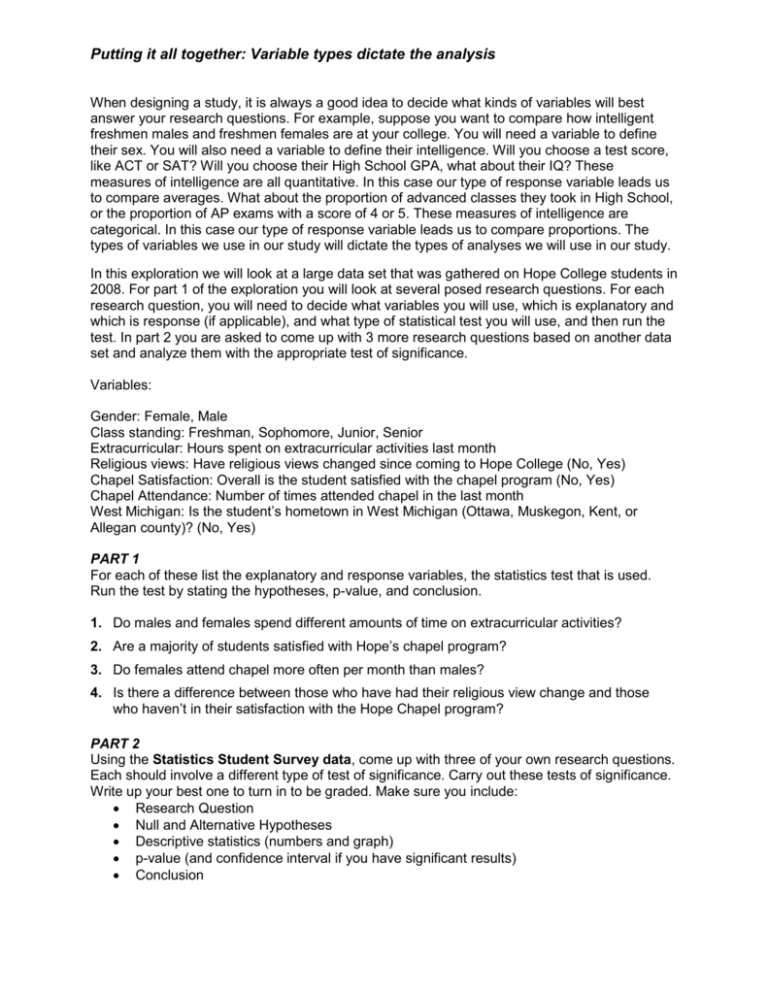
Putting it all together: Variable types dictate the analysis When designing a study, it is always a good idea to decide what kinds of variables will best answer your research questions. For example, suppose you want to compare how intelligent freshmen males and freshmen females are at your college. You will need a variable to define their sex. You will also need a variable to define their intelligence. Will you choose a test score, like ACT or SAT? Will you choose their High School GPA, what about their IQ? These measures of intelligence are all quantitative. In this case our type of response variable leads us to compare averages. What about the proportion of advanced classes they took in High School, or the proportion of AP exams with a score of 4 or 5. These measures of intelligence are categorical. In this case our type of response variable leads us to compare proportions. The types of variables we use in our study will dictate the types of analyses we will use in our study. In this exploration we will look at a large data set that was gathered on Hope College students in 2008. For part 1 of the exploration you will look at several posed research questions. For each research question, you will need to decide what variables you will use, which is explanatory and which is response (if applicable), and what type of statistical test you will use, and then run the test. In part 2 you are asked to come up with 3 more research questions based on another data set and analyze them with the appropriate test of significance. Variables: Gender: Female, Male Class standing: Freshman, Sophomore, Junior, Senior Extracurricular: Hours spent on extracurricular activities last month Religious views: Have religious views changed since coming to Hope College (No, Yes) Chapel Satisfaction: Overall is the student satisfied with the chapel program (No, Yes) Chapel Attendance: Number of times attended chapel in the last month West Michigan: Is the student’s hometown in West Michigan (Ottawa, Muskegon, Kent, or Allegan county)? (No, Yes) PART 1 For each of these list the explanatory and response variables, the statistics test that is used. Run the test by stating the hypotheses, p-value, and conclusion. 1. Do males and females spend different amounts of time on extracurricular activities? 2. Are a majority of students satisfied with Hope’s chapel program? 3. Do females attend chapel more often per month than males? 4. Is there a difference between those who have had their religious view change and those who haven’t in their satisfaction with the Hope Chapel program? PART 2 Using the Statistics Student Survey data, come up with three of your own research questions. Each should involve a different type of test of significance. Carry out these tests of significance. Write up your best one to turn in to be graded. Make sure you include: Research Question Null and Alternative Hypotheses Descriptive statistics (numbers and graph) p-value (and confidence interval if you have significant results) Conclusion
