CS 621 * Genetic Mapping
advertisement
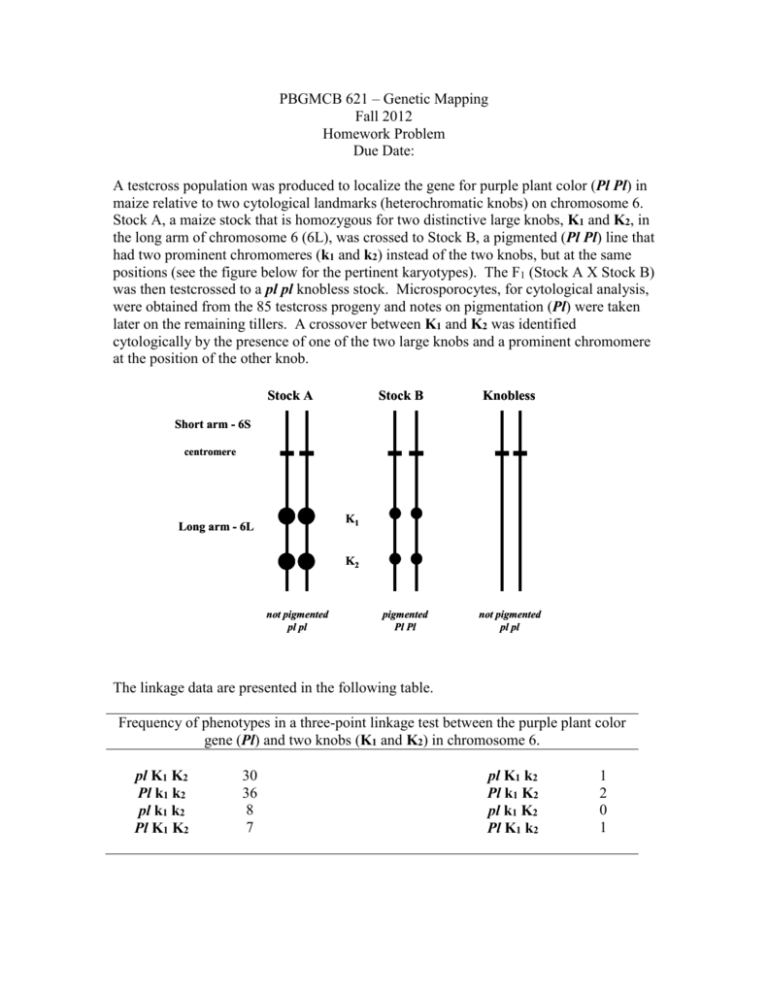
PBGMCB 621 – Genetic Mapping Fall 2012 Homework Problem Due Date: A testcross population was produced to localize the gene for purple plant color (Pl Pl) in maize relative to two cytological landmarks (heterochromatic knobs) on chromosome 6. Stock A, a maize stock that is homozygous for two distinctive large knobs, K1 and K2, in the long arm of chromosome 6 (6L), was crossed to Stock B, a pigmented (Pl Pl) line that had two prominent chromomeres (k1 and k2) instead of the two knobs, but at the same positions (see the figure below for the pertinent karyotypes). The F1 (Stock A X Stock B) was then testcrossed to a pl pl knobless stock. Microsporocytes, for cytological analysis, were obtained from the 85 testcross progeny and notes on pigmentation (Pl) were taken later on the remaining tillers. A crossover between K1 and K2 was identified cytologically by the presence of one of the two large knobs and a prominent chromomere at the position of the other knob. Stock A Stock B Knobless Short arm - 6S centromere K1 Long arm - 6L K2 not pigmented pl pl pigmented Pl Pl not pigmented pl pl The linkage data are presented in the following table. Frequency of phenotypes in a three-point linkage test between the purple plant color gene (Pl) and two knobs (K1 and K2) in chromosome 6. pl K1 K2 Pl k1 k2 pl k1 k2 Pl K1 K2 30 36 8 7 pl K1 k2 Pl k1 K2 pl k1 K2 Pl K1 k2 1 2 0 1 Using the linkage data perform the following analyses. 1. Determine if there is segregation distortion for the three loci (Pl, K1, and K2) using log likelihood ratio (G) statistics. Explain your results. 2. Determine if the three loci (Pl, K1, and K2) are genetically linked using log likelihood ratio (G) statistics. Explain your results. 3. Calculate all possible recombination fractions. 4. Determine the position of Pl in relation to the two knobs (K1 and K2). a. Show that the correct order will result in the minimum sum of adjacent recombination fractions. b. Show that the correct order minimizes the number of double-crossovers. 5. Draw a map with Pl, K1, and K2 using: a. the Kosambi mapping function; and b. the Haldane mapping function 6. Calculate the coefficient of coincidence for the order you obtained in 4. Is interference positive or negative? What does this mean? NOTE – Show your calculations or strategy for every step. You may use any computing device or software for calculations except one that is specifically designed to do genetic mapping.


![Cytological Studies Of Maize [Zea Mays L.] and Teosinte](http://s3.studylib.net/store/data/009550557_1-3a9d1be429a9d302239ace39bdea9ce1-300x300.png)

