6th Grade Instructional Guide RP
advertisement
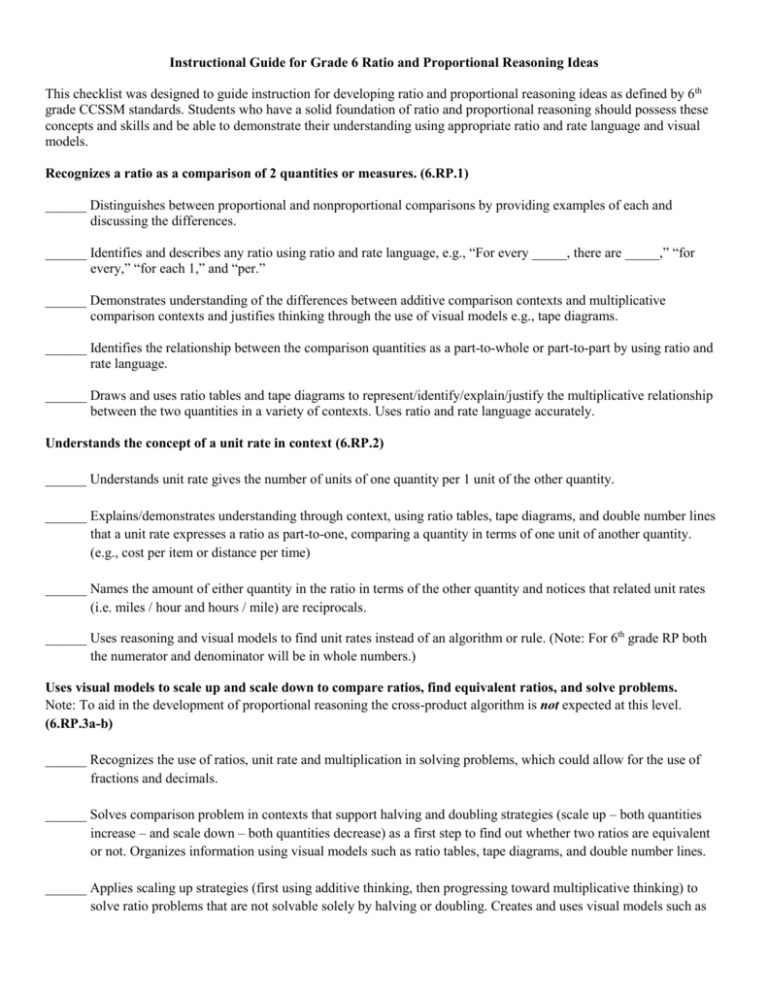
Instructional Guide for Grade 6 Ratio and Proportional Reasoning Ideas This checklist was designed to guide instruction for developing ratio and proportional reasoning ideas as defined by 6 th grade CCSSM standards. Students who have a solid foundation of ratio and proportional reasoning should possess these concepts and skills and be able to demonstrate their understanding using appropriate ratio and rate language and visual models. Recognizes a ratio as a comparison of 2 quantities or measures. (6.RP.1) ______ Distinguishes between proportional and nonproportional comparisons by providing examples of each and discussing the differences. ______ Identifies and describes any ratio using ratio and rate language, e.g., “For every _____, there are _____,” “for every,” “for each 1,” and “per.” ______ Demonstrates understanding of the differences between additive comparison contexts and multiplicative comparison contexts and justifies thinking through the use of visual models e.g., tape diagrams. ______ Identifies the relationship between the comparison quantities as a part-to-whole or part-to-part by using ratio and rate language. ______ Draws and uses ratio tables and tape diagrams to represent/identify/explain/justify the multiplicative relationship between the two quantities in a variety of contexts. Uses ratio and rate language accurately. Understands the concept of a unit rate in context (6.RP.2) ______ Understands unit rate gives the number of units of one quantity per 1 unit of the other quantity. ______ Explains/demonstrates understanding through context, using ratio tables, tape diagrams, and double number lines that a unit rate expresses a ratio as part-to-one, comparing a quantity in terms of one unit of another quantity. (e.g., cost per item or distance per time) ______ Names the amount of either quantity in the ratio in terms of the other quantity and notices that related unit rates (i.e. miles / hour and hours / mile) are reciprocals. ______ Uses reasoning and visual models to find unit rates instead of an algorithm or rule. (Note: For 6th grade RP both the numerator and denominator will be in whole numbers.) Uses visual models to scale up and scale down to compare ratios, find equivalent ratios, and solve problems. Note: To aid in the development of proportional reasoning the cross-product algorithm is not expected at this level. (6.RP.3a-b) ______ Recognizes the use of ratios, unit rate and multiplication in solving problems, which could allow for the use of fractions and decimals. ______ Solves comparison problem in contexts that support halving and doubling strategies (scale up – both quantities increase – and scale down – both quantities decrease) as a first step to find out whether two ratios are equivalent or not. Organizes information using visual models such as ratio tables, tape diagrams, and double number lines. ______ Applies scaling up strategies (first using additive thinking, then progressing toward multiplicative thinking) to solve ratio problems that are not solvable solely by halving or doubling. Creates and uses visual models such as ratio tables, tape diagrams, and double number lines to solve scaling up problems. Refers to visual model as solution strategies are explained. ______ Applies reasoning up and reasoning down strategies – first using addition, then progressing toward a combination of addition, multiplication, subtraction and division and then finally using multiplication and division – to solve ratio problems that are not solvable solely by halving or doubling. Creates and uses visual models such as ratio tables, tape diagrams, and double number lines to solve scaling up and scaling down problems. Refers to visual model as solution strategies are explained. Find the Percent of a Quantity (6.RP.3c) ______ Recognizes that percent is a special kind of ratio in which the second quantity is always 100. ______ Uses a variety of strategies to model and solve percent problems including scaling up and scaling down, using ratio tables, tape diagrams and double number lines. ______ Solve problems using visual models that involve finding the whole, given a part and the percent.
