Instructional Alignment Chart (6-8)
advertisement
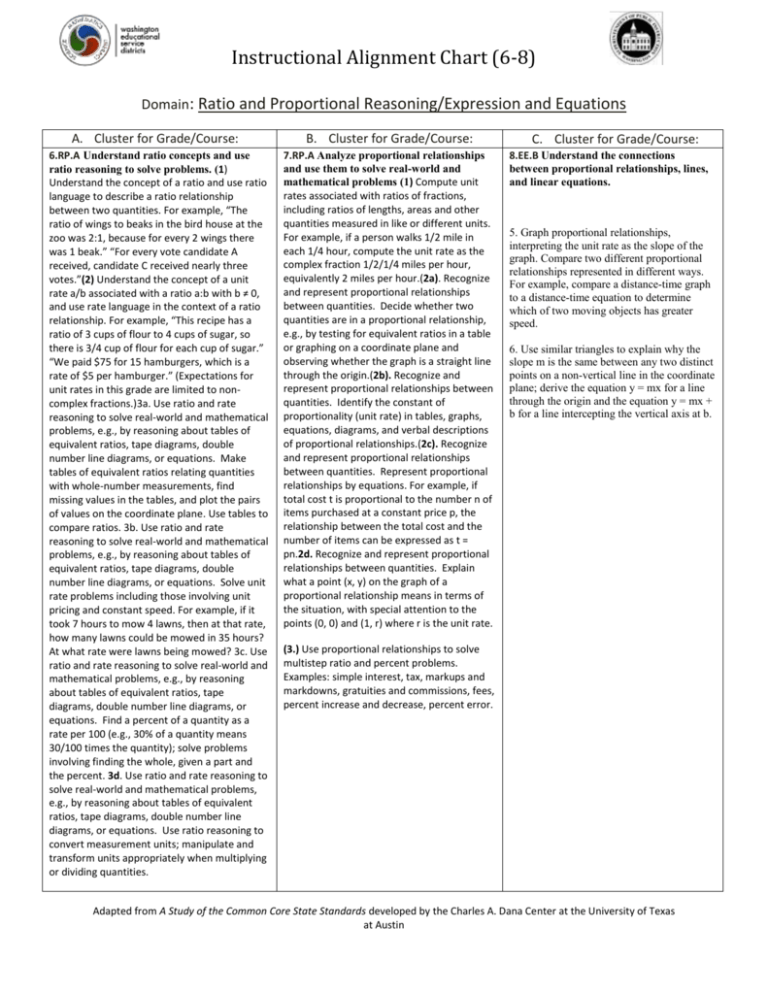
Instructional Alignment Chart (6-8) Domain: Ratio and Proportional Reasoning/Expression and Equations A. Cluster for Grade/Course: 6.RP.A Understand ratio concepts and use ratio reasoning to solve problems. (1) Understand the concept of a ratio and use ratio language to describe a ratio relationship between two quantities. For example, “The ratio of wings to beaks in the bird house at the zoo was 2:1, because for every 2 wings there was 1 beak.” “For every vote candidate A received, candidate C received nearly three votes.”(2) Understand the concept of a unit rate a/b associated with a ratio a:b with b ≠ 0, and use rate language in the context of a ratio relationship. For example, “This recipe has a ratio of 3 cups of flour to 4 cups of sugar, so there is 3/4 cup of flour for each cup of sugar.” “We paid $75 for 15 hamburgers, which is a rate of $5 per hamburger.” (Expectations for unit rates in this grade are limited to noncomplex fractions.)3a. Use ratio and rate reasoning to solve real-world and mathematical problems, e.g., by reasoning about tables of equivalent ratios, tape diagrams, double number line diagrams, or equations. Make tables of equivalent ratios relating quantities with whole-number measurements, find missing values in the tables, and plot the pairs of values on the coordinate plane. Use tables to compare ratios. 3b. Use ratio and rate reasoning to solve real-world and mathematical problems, e.g., by reasoning about tables of equivalent ratios, tape diagrams, double number line diagrams, or equations. Solve unit rate problems including those involving unit pricing and constant speed. For example, if it took 7 hours to mow 4 lawns, then at that rate, how many lawns could be mowed in 35 hours? At what rate were lawns being mowed? 3c. Use ratio and rate reasoning to solve real-world and mathematical problems, e.g., by reasoning about tables of equivalent ratios, tape diagrams, double number line diagrams, or equations. Find a percent of a quantity as a rate per 100 (e.g., 30% of a quantity means 30/100 times the quantity); solve problems involving finding the whole, given a part and the percent. 3d. Use ratio and rate reasoning to solve real-world and mathematical problems, e.g., by reasoning about tables of equivalent ratios, tape diagrams, double number line diagrams, or equations. Use ratio reasoning to convert measurement units; manipulate and transform units appropriately when multiplying or dividing quantities. B. Cluster for Grade/Course: 7.RP.A Analyze proportional relationships and use them to solve real-world and mathematical problems (1) Compute unit rates associated with ratios of fractions, including ratios of lengths, areas and other quantities measured in like or different units. For example, if a person walks 1/2 mile in each 1/4 hour, compute the unit rate as the complex fraction 1/2/1/4 miles per hour, equivalently 2 miles per hour.(2a). Recognize and represent proportional relationships between quantities. Decide whether two quantities are in a proportional relationship, e.g., by testing for equivalent ratios in a table or graphing on a coordinate plane and observing whether the graph is a straight line through the origin.(2b). Recognize and represent proportional relationships between quantities. Identify the constant of proportionality (unit rate) in tables, graphs, equations, diagrams, and verbal descriptions of proportional relationships.(2c). Recognize and represent proportional relationships between quantities. Represent proportional relationships by equations. For example, if total cost t is proportional to the number n of items purchased at a constant price p, the relationship between the total cost and the number of items can be expressed as t = pn.2d. Recognize and represent proportional relationships between quantities. Explain what a point (x, y) on the graph of a proportional relationship means in terms of the situation, with special attention to the points (0, 0) and (1, r) where r is the unit rate. C. Cluster for Grade/Course: 8.EE.B Understand the connections between proportional relationships, lines, and linear equations. 5. Graph proportional relationships, interpreting the unit rate as the slope of the graph. Compare two different proportional relationships represented in different ways. For example, compare a distance-time graph to a distance-time equation to determine which of two moving objects has greater speed. 6. Use similar triangles to explain why the slope m is the same between any two distinct points on a non-vertical line in the coordinate plane; derive the equation y = mx for a line through the origin and the equation y = mx + b for a line intercepting the vertical axis at b. (3.) Use proportional relationships to solve multistep ratio and percent problems. Examples: simple interest, tax, markups and markdowns, gratuities and commissions, fees, percent increase and decrease, percent error. Adapted from A Study of the Common Core State Standards developed by the Charles A. Dana Center at the University of Texas at Austin Instructional Alignment Chart (6-8) D. Changes Ratios move from whole numbers to complex fractions Solving proportions as equations Scale factor Tables, graphs, and equations Move from additive thinking to multiplicative thinking E. Changes Interprets a unit rate as slope Compare different proportions in different ways F. Levels of Instruction (Seventh Grade) Provide Reinforcement Activities Multiplicative thinking should be reinforced from 6th grade experiences Provide Developmental Activities Identifying that two quantities are proportional G. Implications for Instruction and Assessment (Seventh Grade) Use larger quantities in solving problems to improve multiplicative thinking Use graphs to help students understand Identify the Standards for Mathematical Practice that will be used to approach the content. Adapted from A Study of the Common Core State Standards developed by the Charles A. Dana Center at the University of Texas at Austin
